A device's own page
Everything about one device. See it in the live demo →
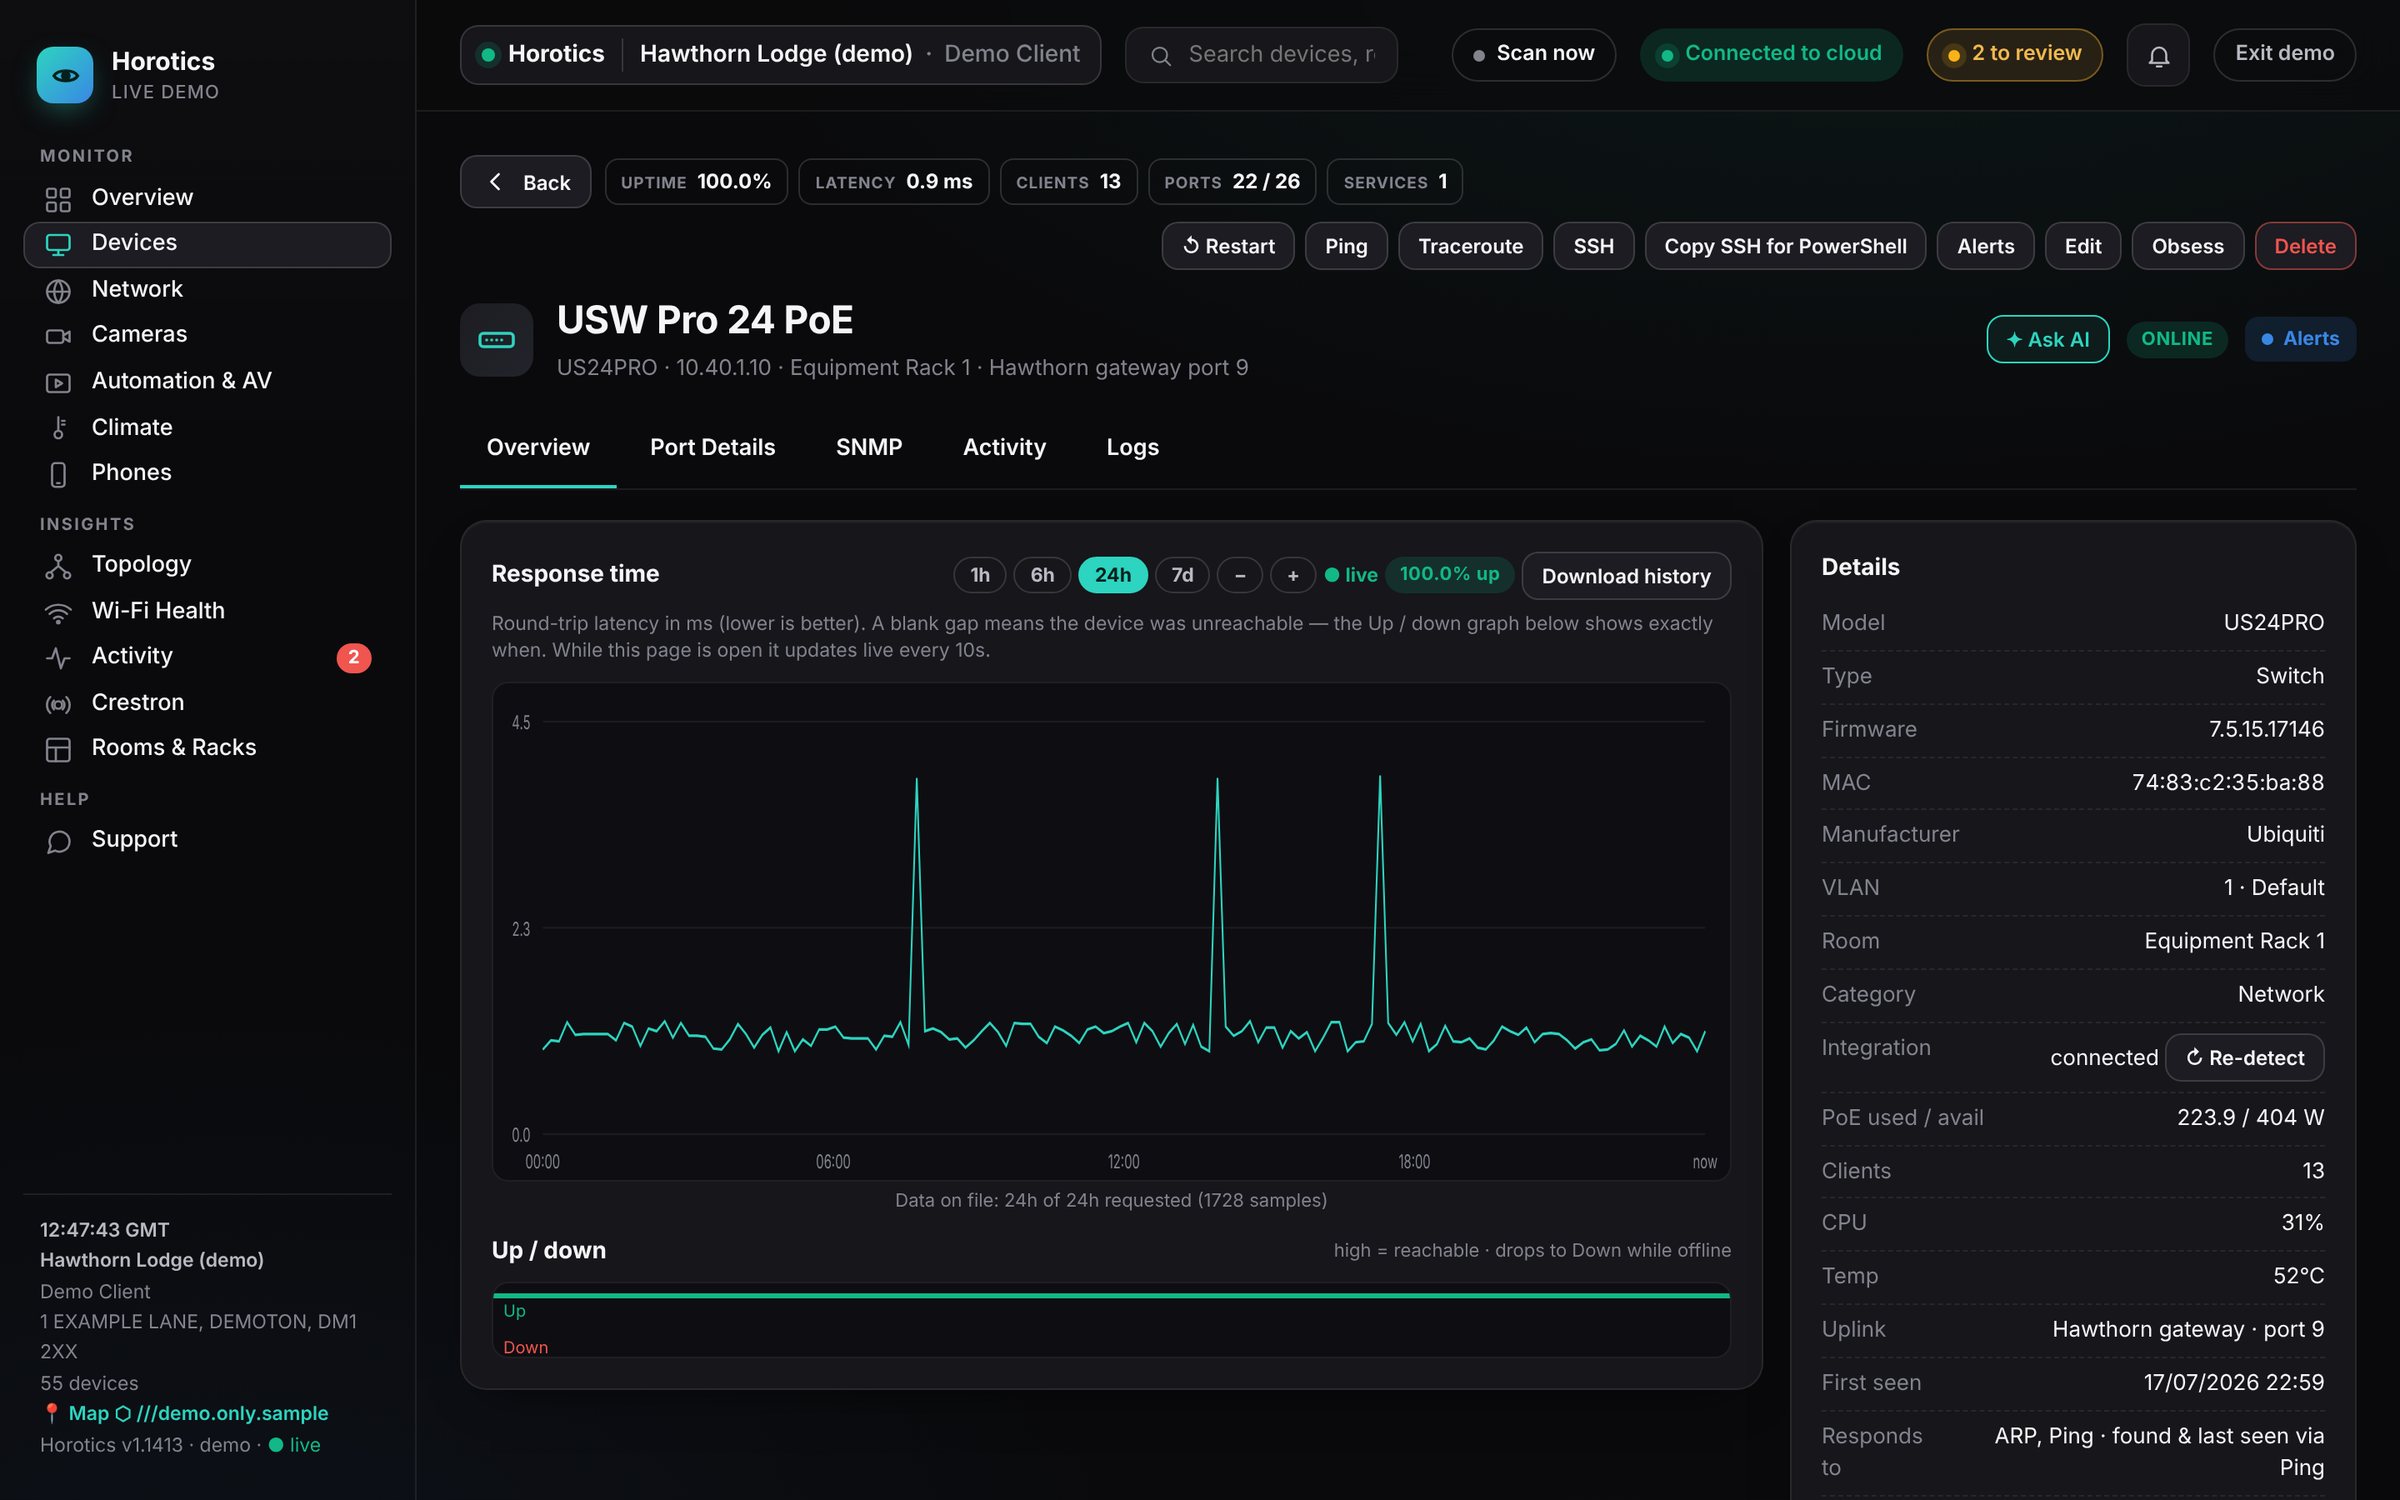
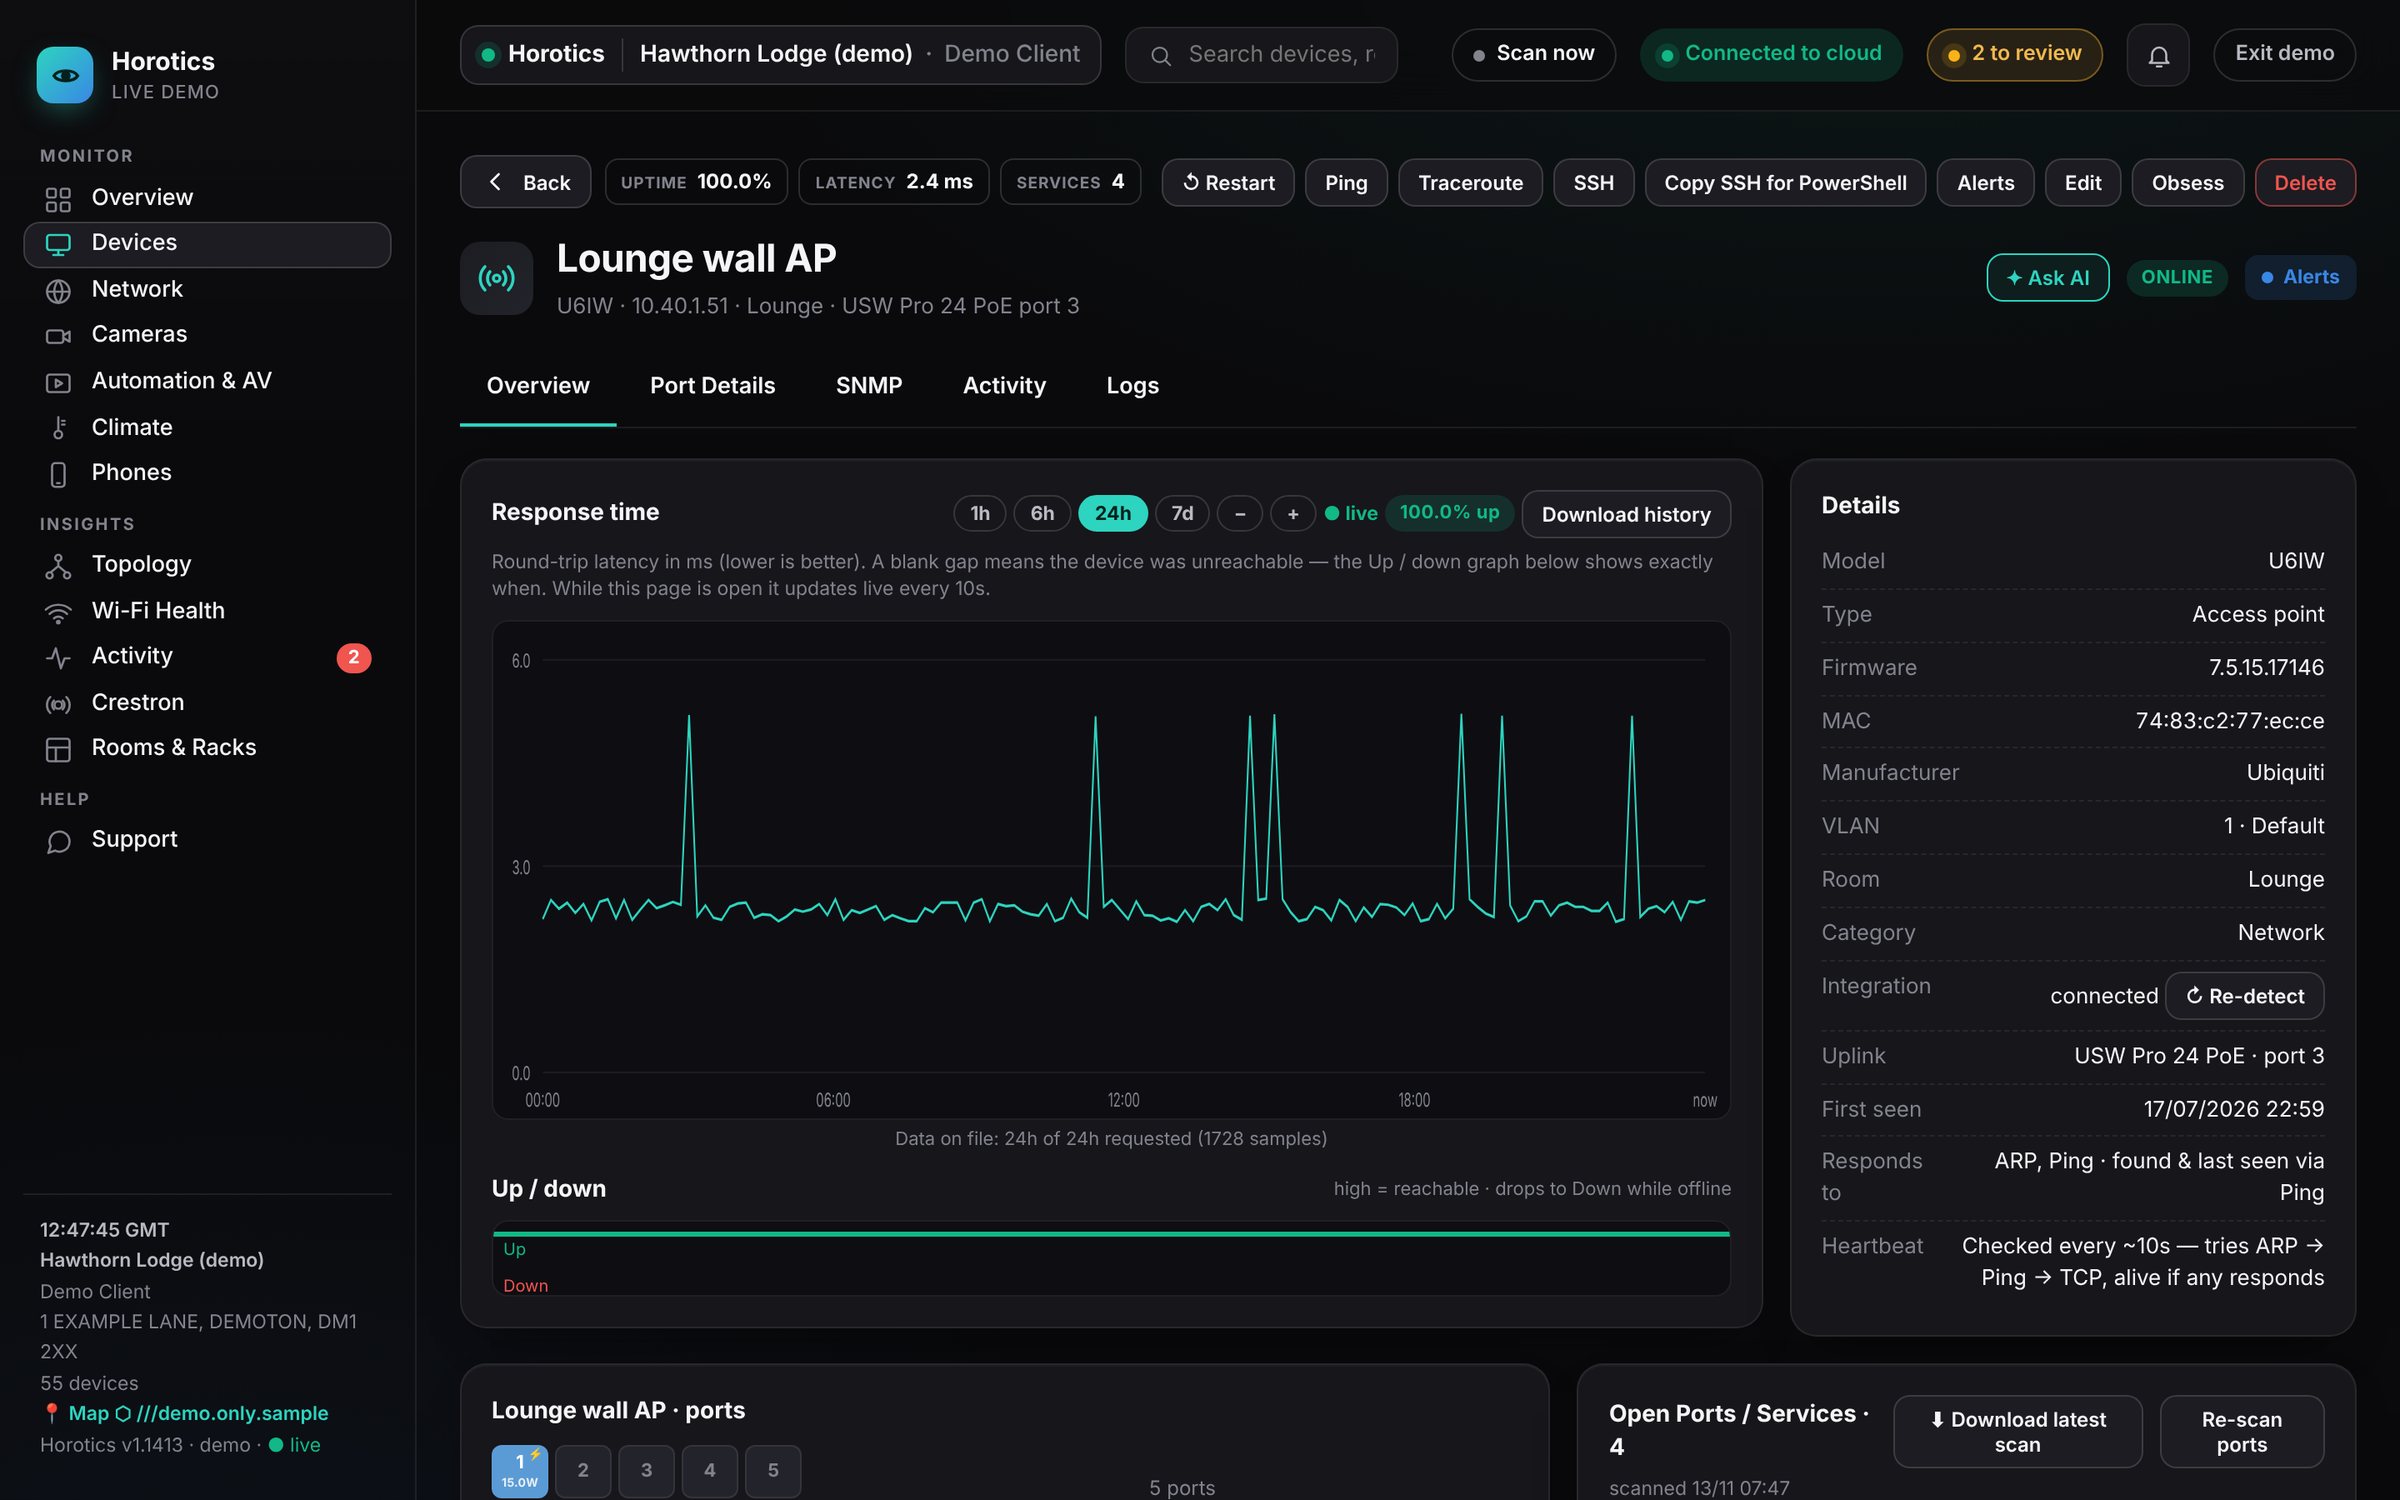
Click any device, from the Devices list, a group, the Topology map or a switch port, and you land on its own page. The top is the same for every device; lower down, the page adapts to the kind of device.
The top

- Headline figures
- Uptime (how much of the time it's been reachable), Latency (how quickly it answers), and, where relevant, Clients, Ports in use and Services.
- Name and summary
- Its name, model, address, room and what it's plugged into (for example "USW Pro 24 PoE port 3").
- Status
- ONLINE or DOWN, and its monitoring setting.
The tools

- Restart
- Restarts the device, for example by cycling its power over the network cable. It always asks you first.
- Ping and Traceroute
- Is it reachable, and by what route?
- SSH / Copy SSH for PowerShell
- Terminal access, for installers.
- Alerts
- This device's alert history.
- Edit
- Change its name, room, category and monitoring.
- Obsess
- Intensive monitoring for a set time (5 to 40 minutes): the box checks this one device continuously, runs a speed test and a security pass, and records everything. Ideal for catching an intermittent fault. How Obsess works.
- ✦ Ask AI
- A plain-English, read-only look at the device's history. It gives advice and never changes anything.
- Delete
- Removes the device from Horotics (not from your network).
The tabs
Under the name are the tabs. Every device has Overview, Activity and Logs. Switches and access points add Port Details and SNMP, and smart equipment adds its own tab, such as Keypads for Lutron or Crestron for a Crestron processor.
Overview
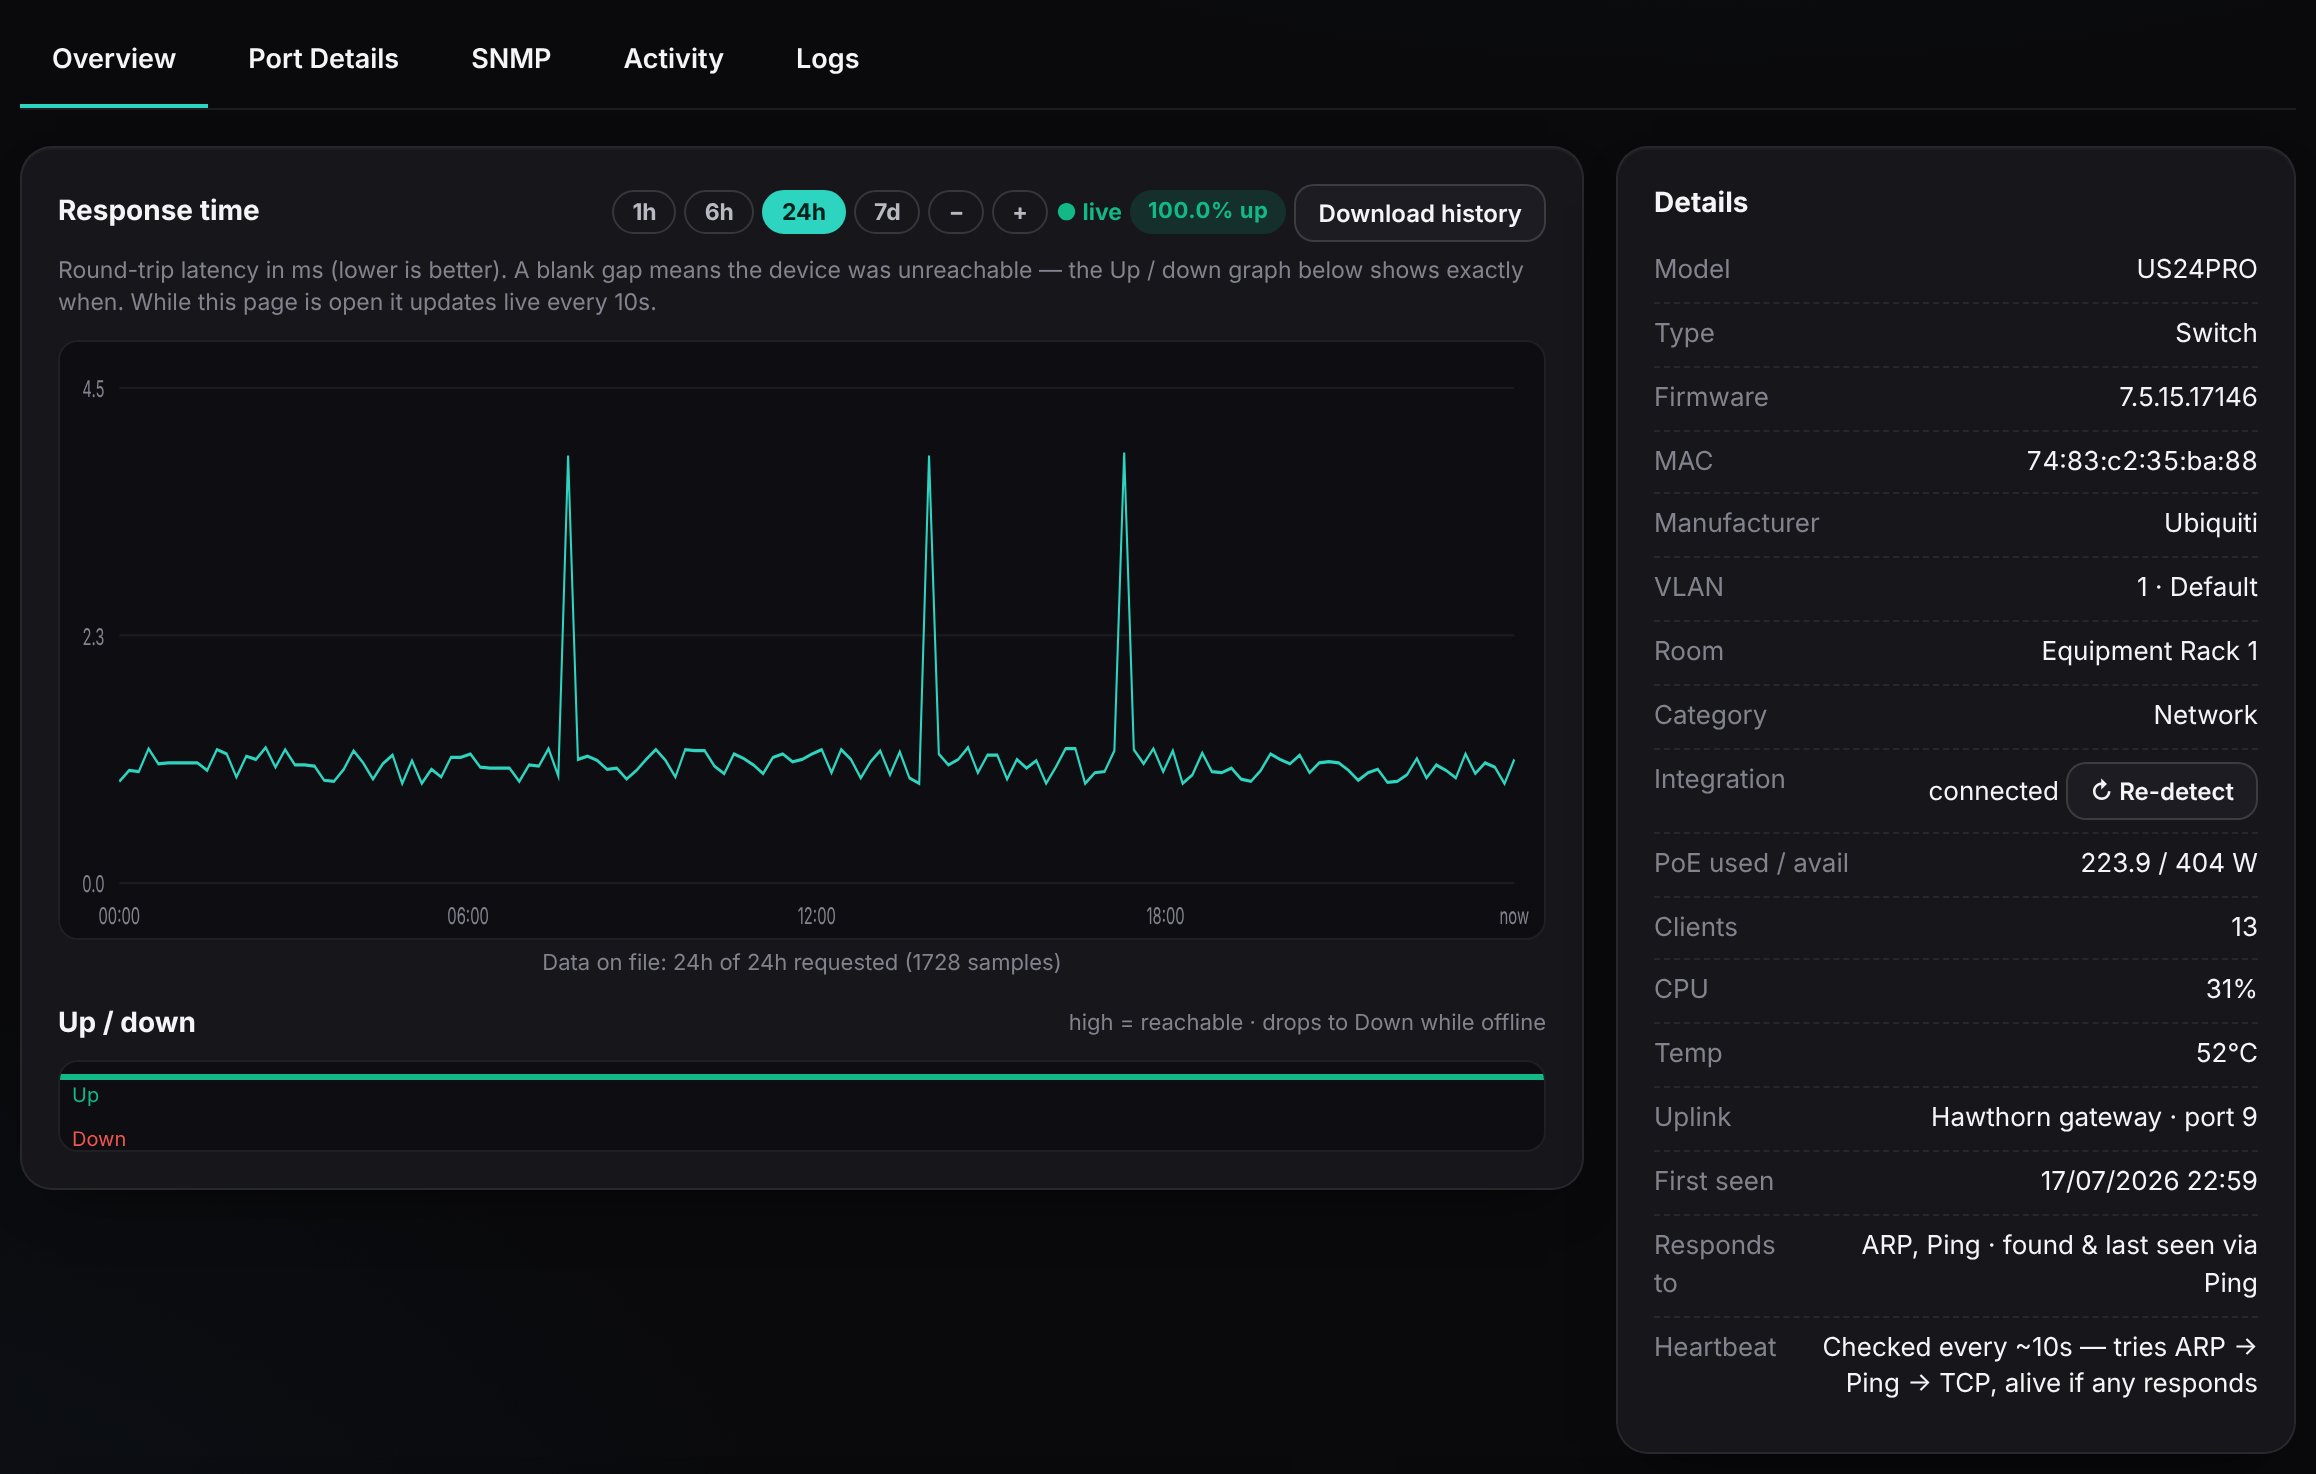
- Response time
- How quickly the device answers, from 1 hour to 7 days. While you watch, it updates live every 10 seconds. A flat, low line is good; spikes are moments it was slow to answer.
- Up / down
- A strip showing exactly when it was reachable (green) and when it wasn't (red), so you can see whether a fault was one long outage or lots of short drops.
- Details
- Model, firmware, MAC, VLAN, room, what it's plugged into, when it was first seen and how the box checks it.
Port Details
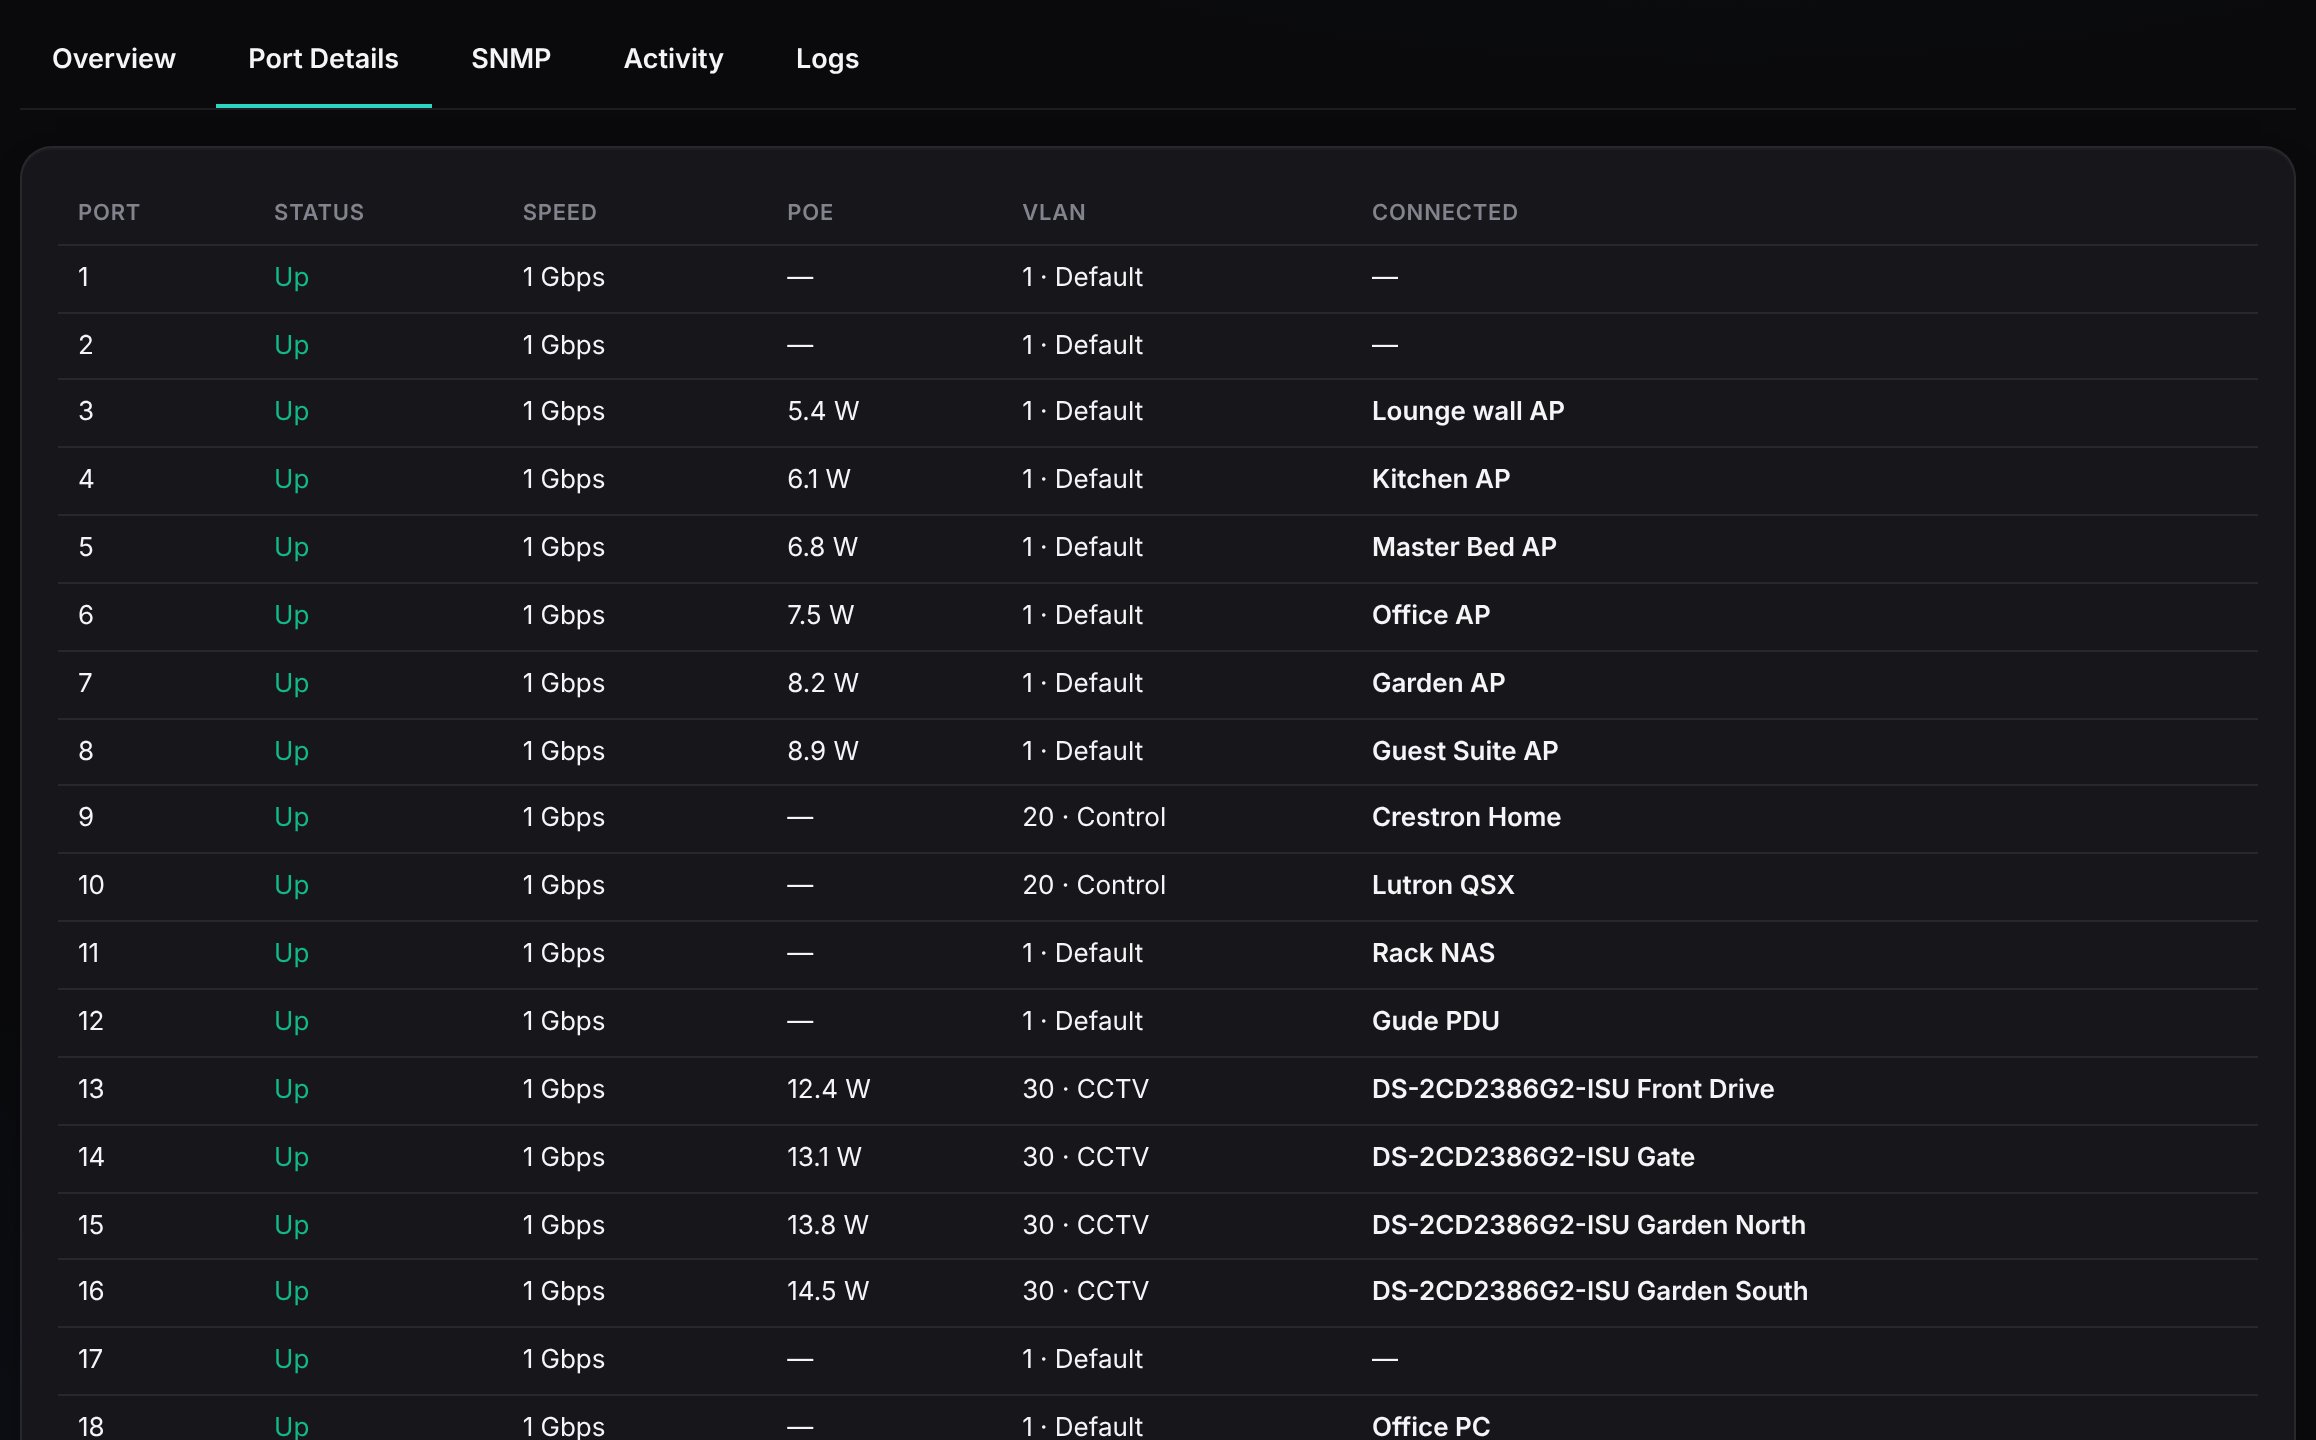
The same information as the port picture, as a list you can read down. For each port: Status (Up or Down), Speed, PoE (the power it's supplying, if any), VLAN (which network lane) and Connected (the device at the other end, where Horotics knows it). It's the quickest way to answer "what's on port 14?".
SNMP
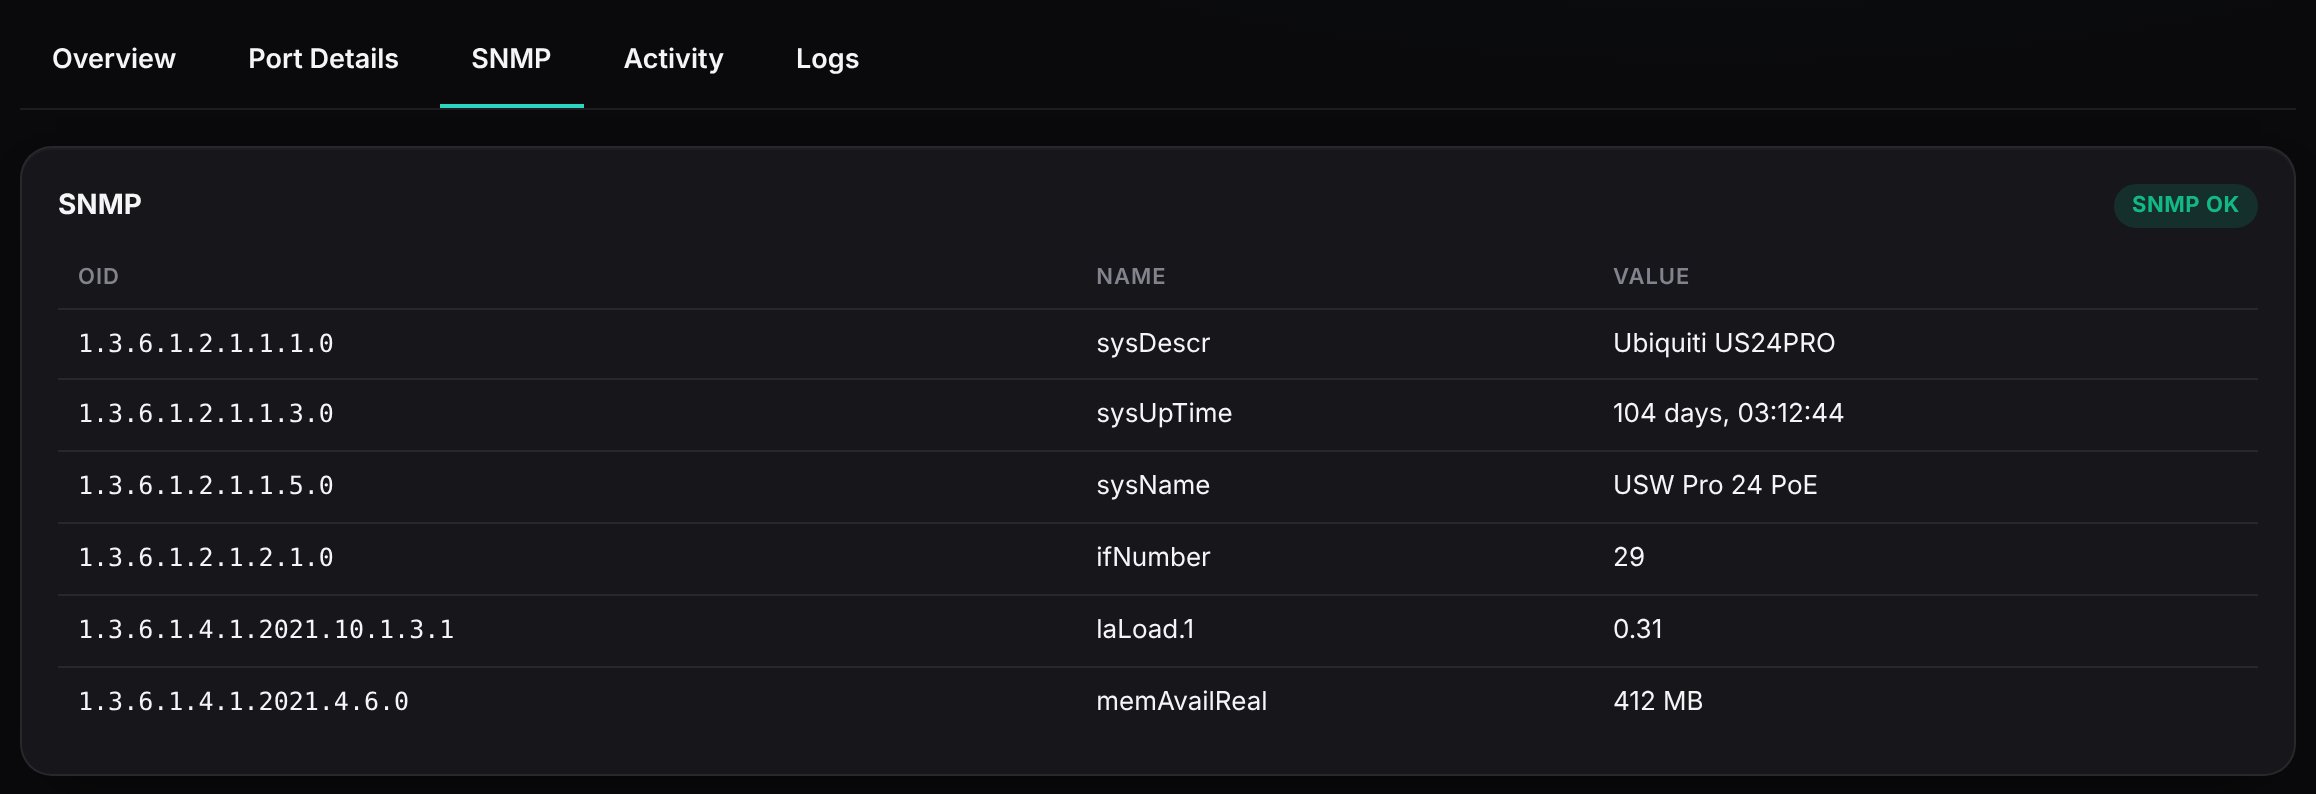
SNMP is the language managed network equipment uses to report on itself. On its own it's a long list of numbered codes and raw figures. Horotics reads all of that and turns it into what you see across the system: the port pictures, speeds, power use, CPU, temperature and traffic graphs, in a clean, readable form instead of lines of code. This tab shows a few of the raw values behind it, such as the device's description, how long it's been running, its load and free memory. SNMP OK means the box is reading it successfully. Mostly for installers; if it says something other than OK, the box can still check the device is up, but can't see inside it.
Activity
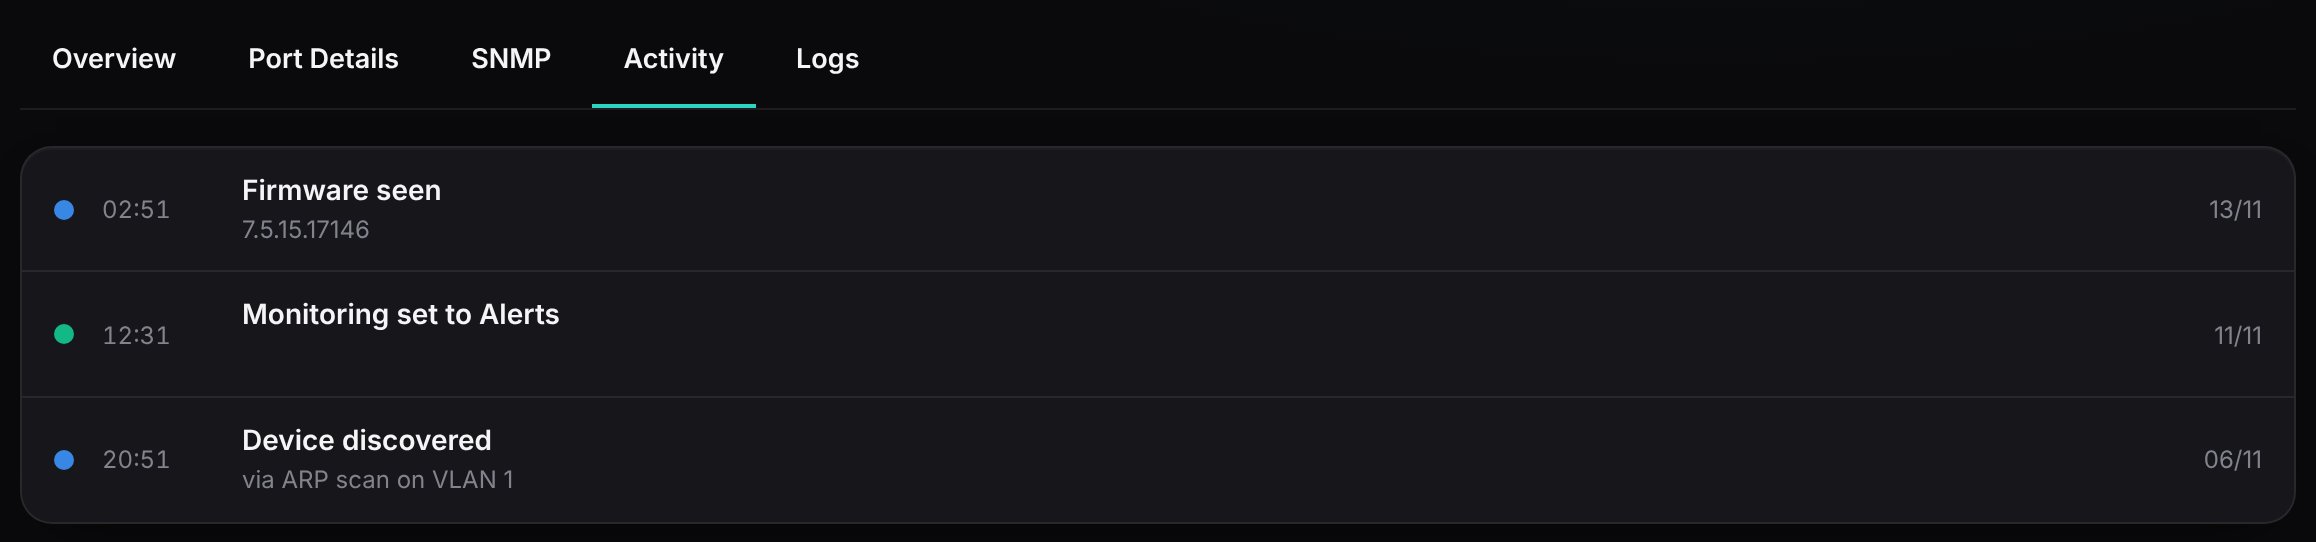
Everything that's happened to this one device, newest first: when it was discovered, when it went down and came back, firmware changes and changes to its monitoring. It's the same as the Activity page, filtered to this device.
Logs
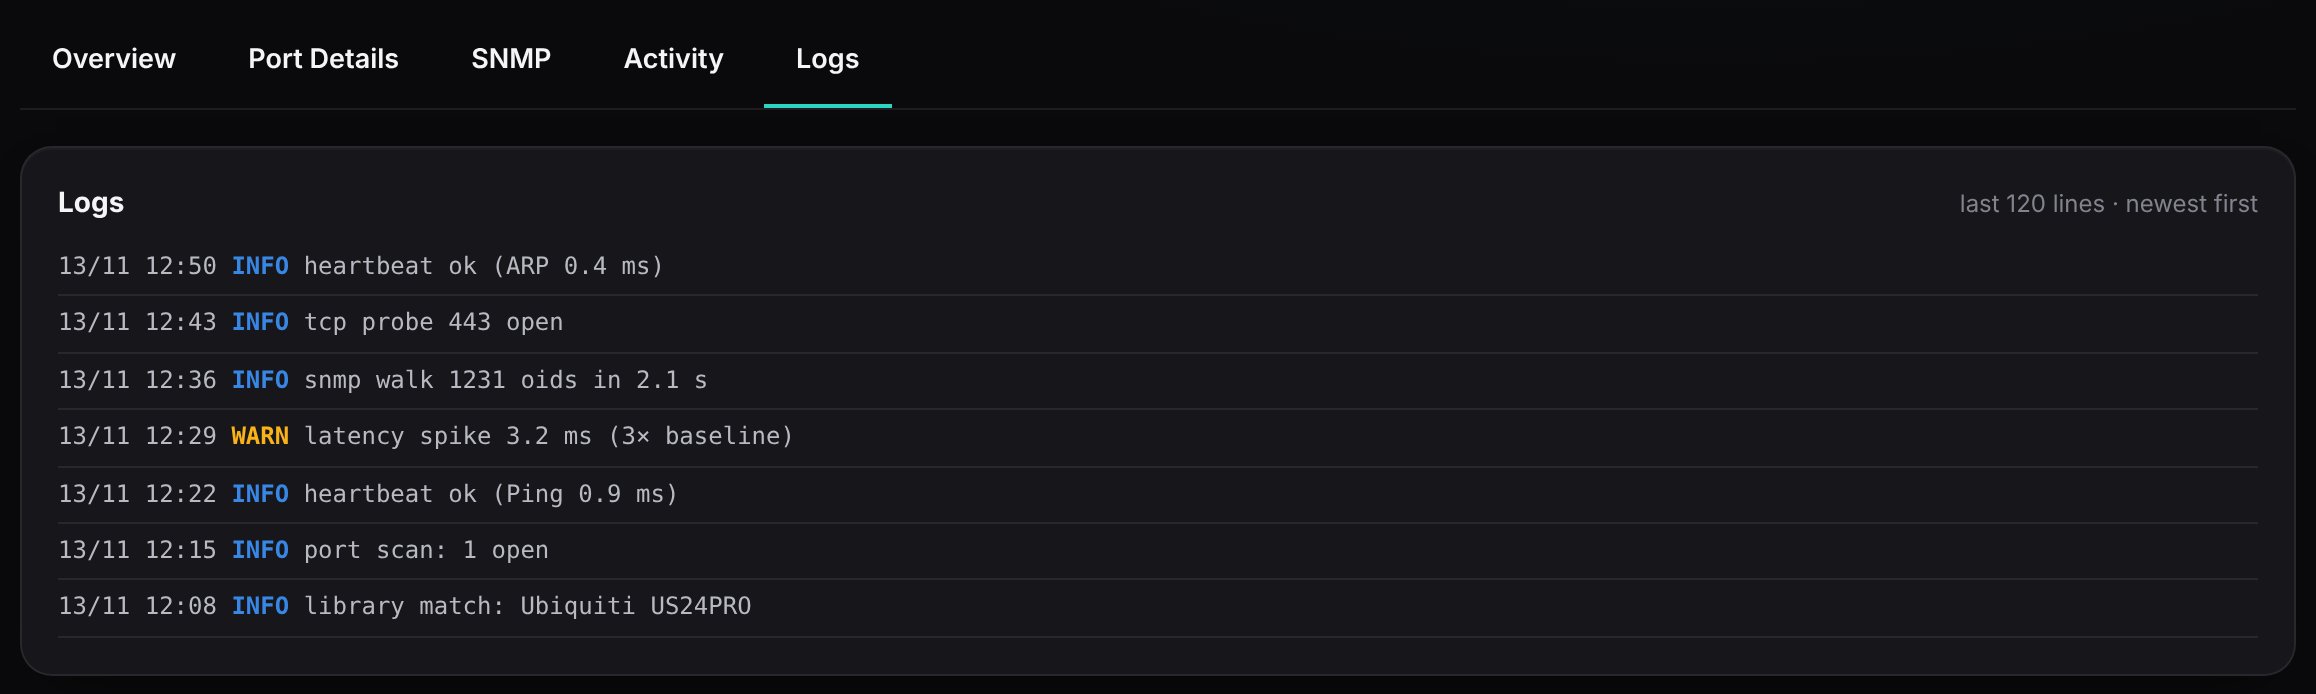
The box's detailed record of every check it made on this device: each heartbeat, port check and SNMP read, with INFO for routine entries and WARN for anything unusual, such as a latency spike. Installers use it to see exactly what happened and when.
Tabs for smart equipment
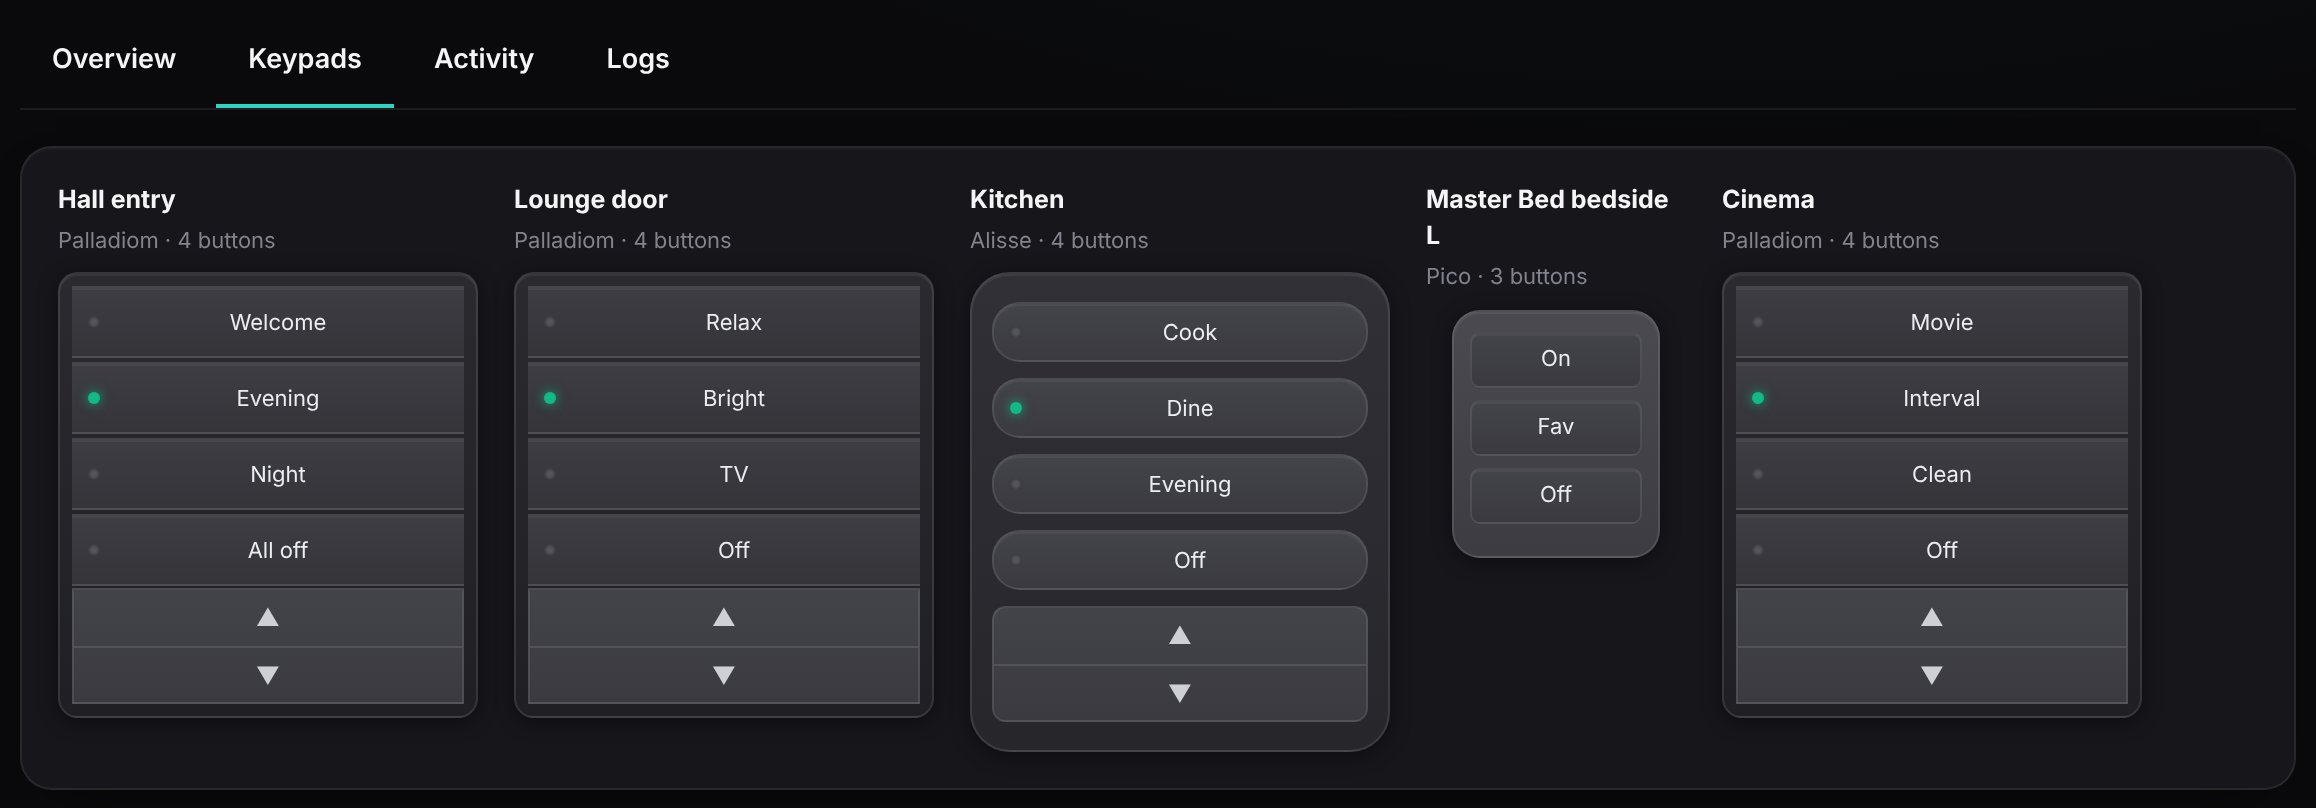
- Keypads (Lutron)
- Every keypad, laid out as it looks on the wall, with its location, style and buttons. The lit dot shows which scene is currently active, so you can check what a keypad is doing without walking to it.
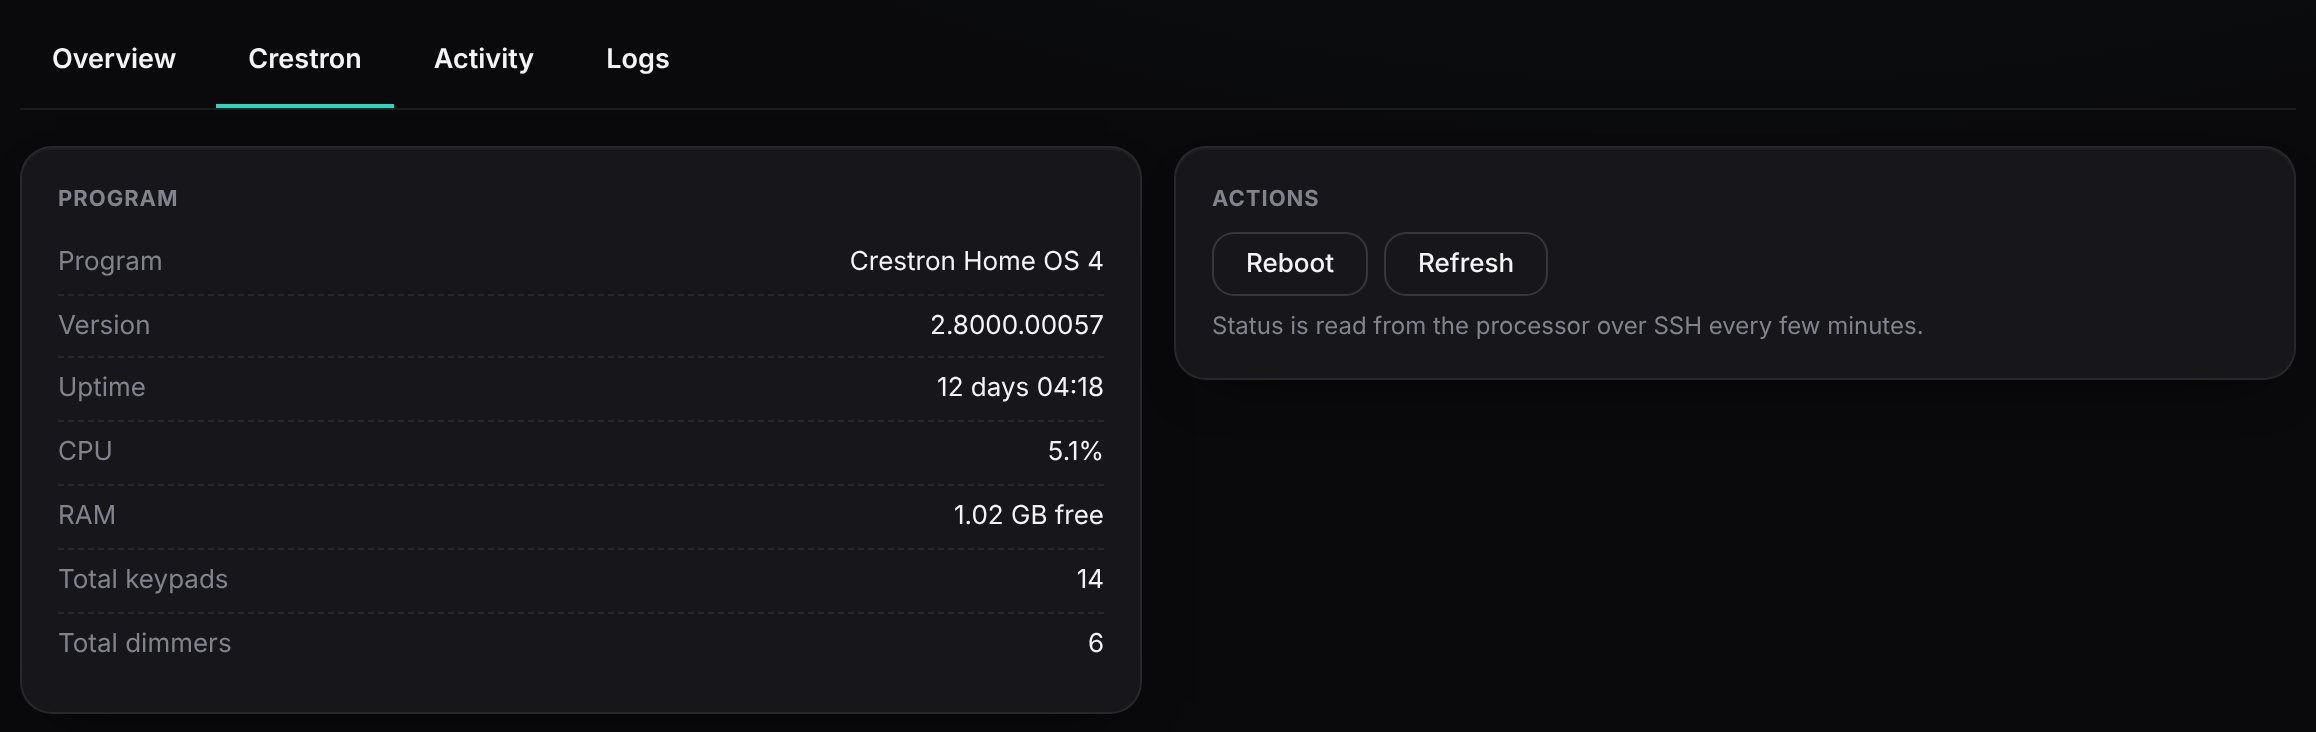
- Crestron
- The processor's program and version, uptime, CPU and memory, and how many keypads and dimmers it controls, with Reboot and Refresh. Reboot always asks first.
Pages that change by device type
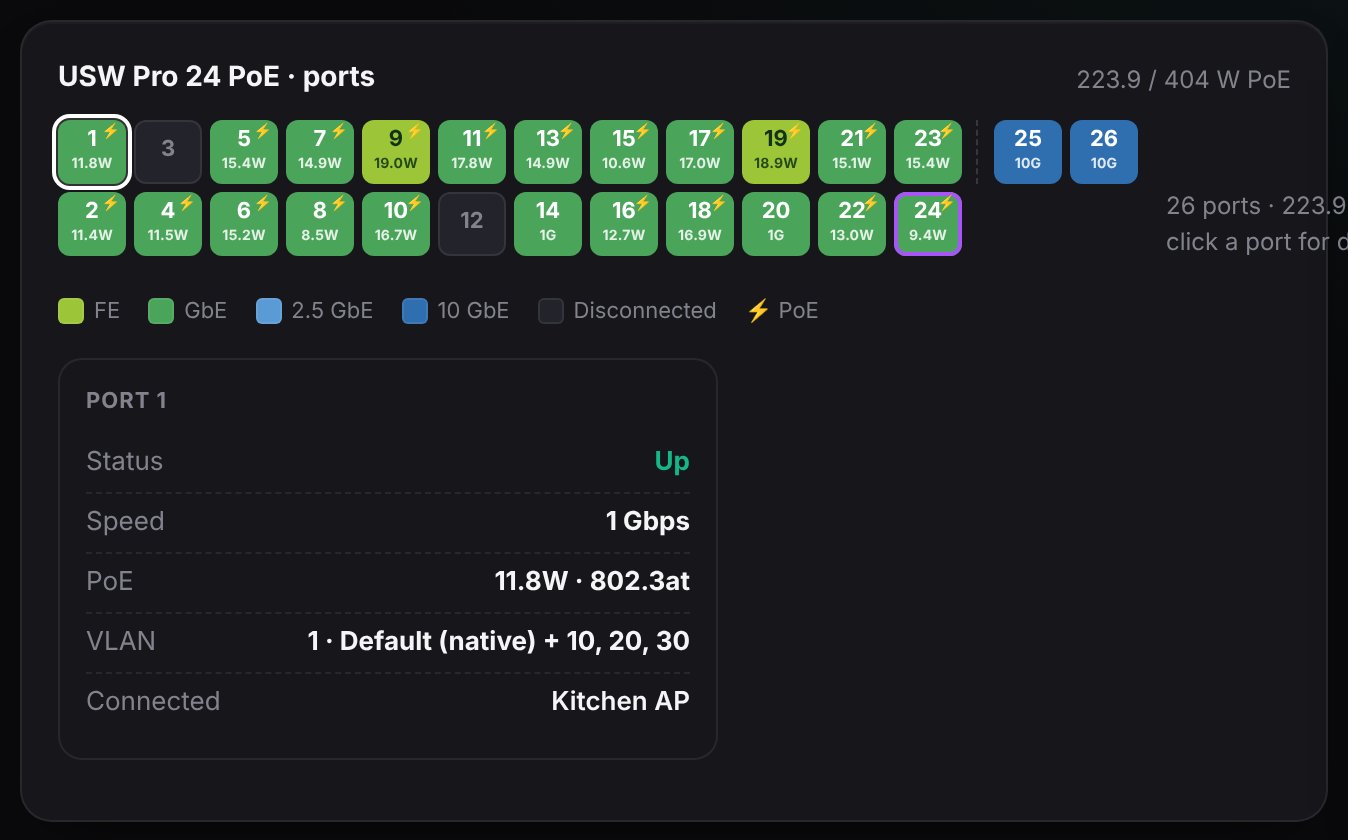
- Switches
- A picture of every port: in use or empty, its speed, the power it's supplying, and trunk/uplink ports marked. Click a port to see its speed, VLAN and what's plugged into it.
- Wi-Fi access points
- Its radios, the networks it broadcasts and the devices connected to it.
- Smart equipment
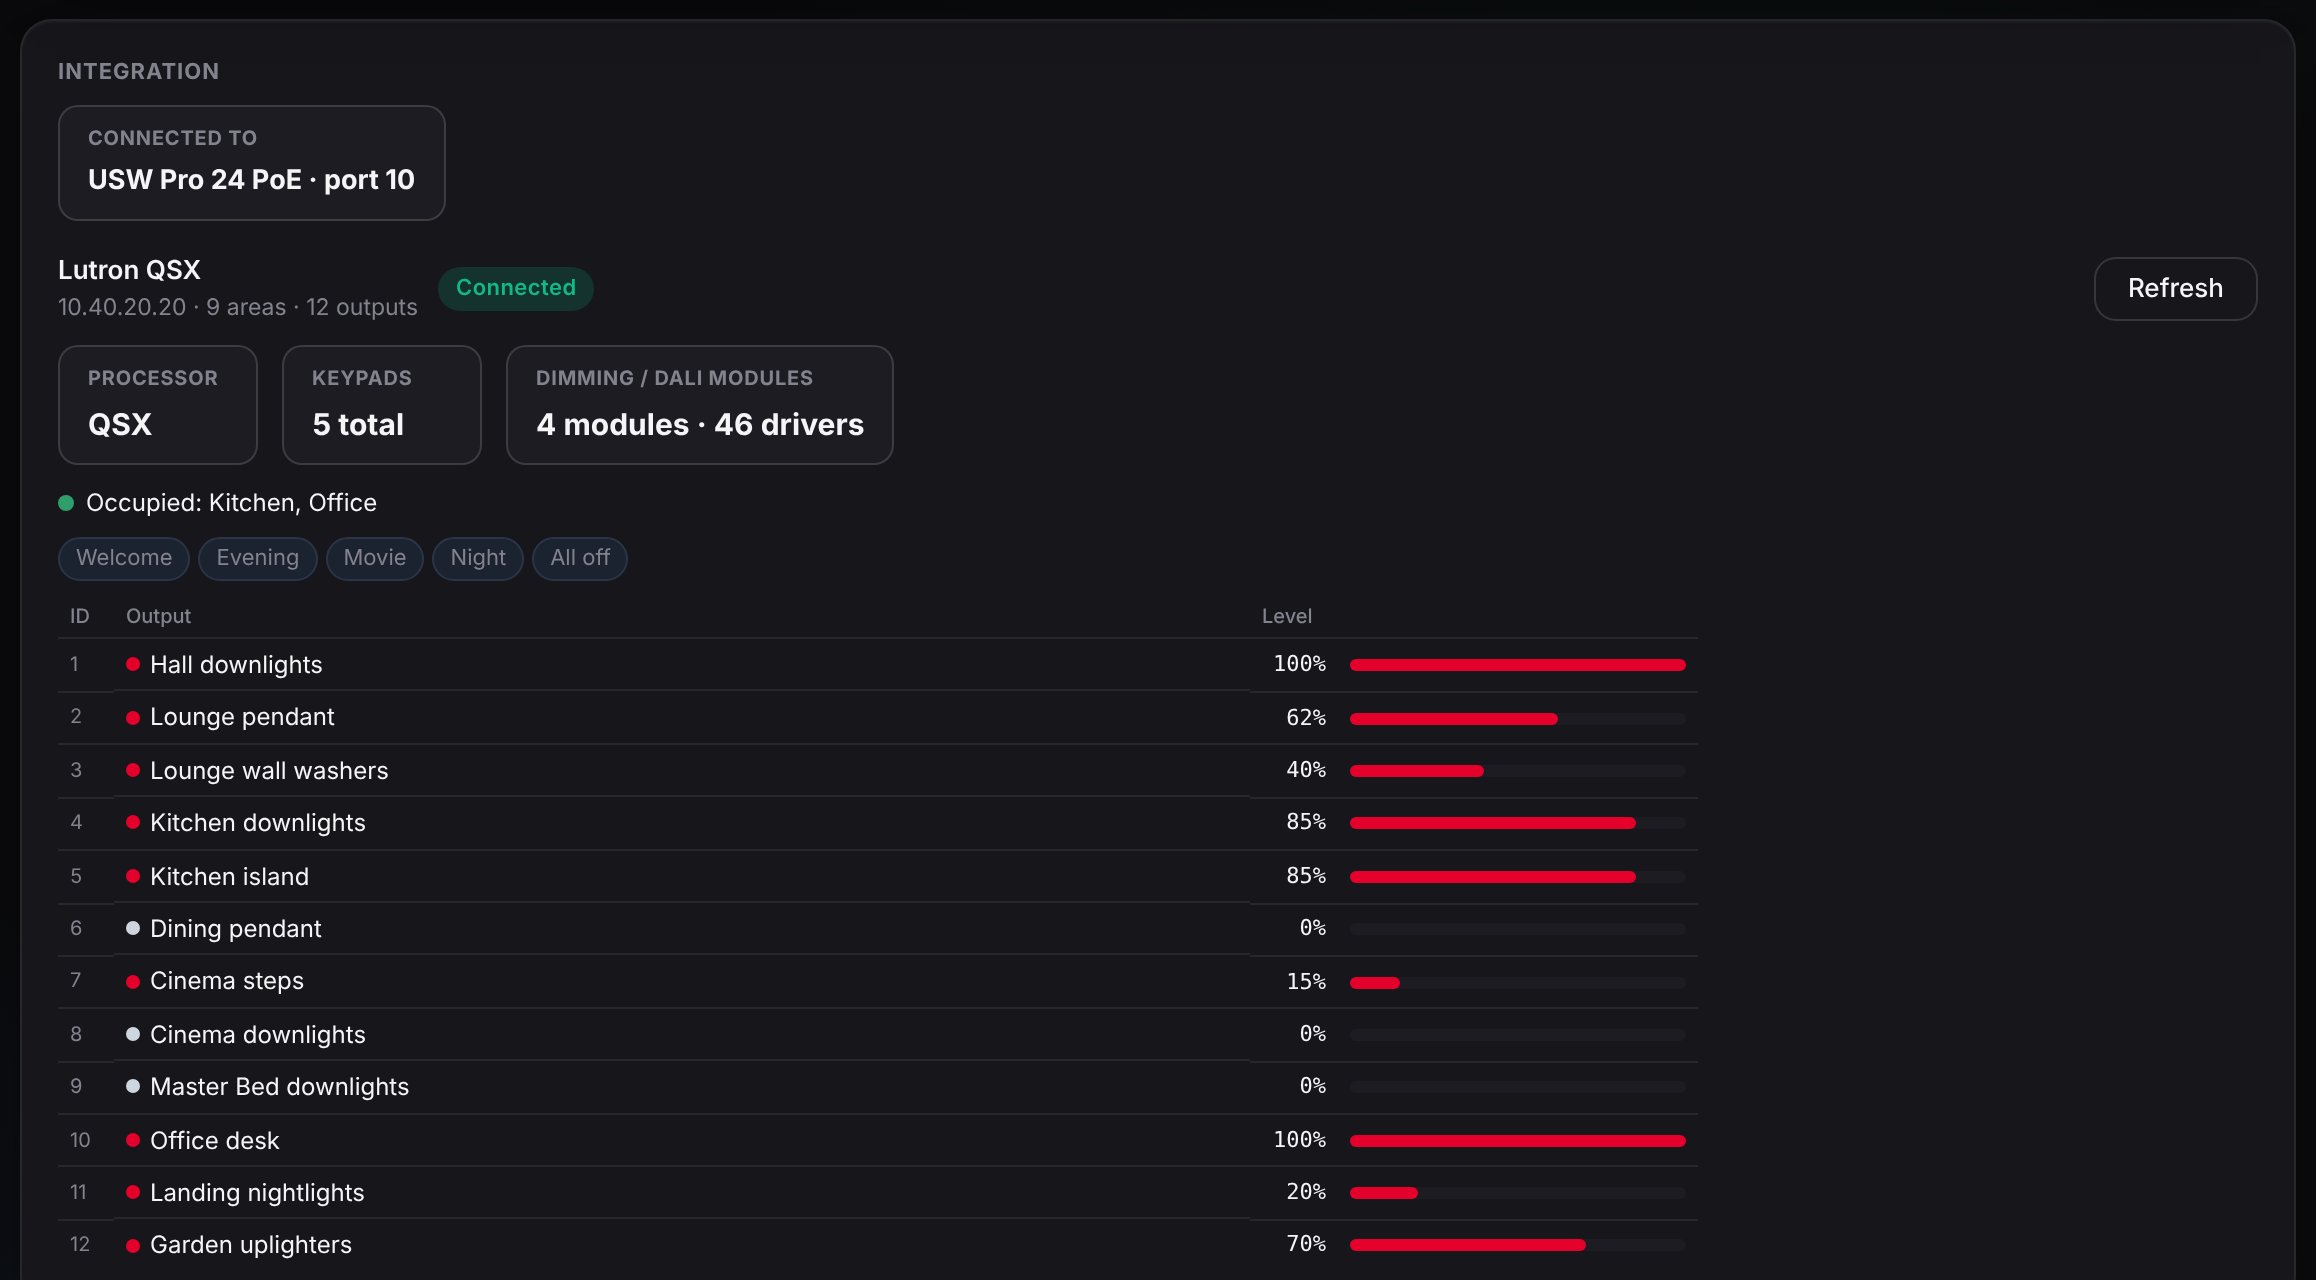
- Integrated systems get their own panel, read live from the equipment. For example: Lutron lighting (processor, keypads, scenes and circuit levels), Crestron processors (uptime, CPU, memory, program and connected devices), heating (each room's temperature and target), NAS storage (disk health and temperature) and PDUs (each outlet's power). The device library is growing daily.
You can't break anything by looking. Anything that would change a device asks you first.