Obsess mode
A deep, short look at one troublesome device. See it in the live demo →
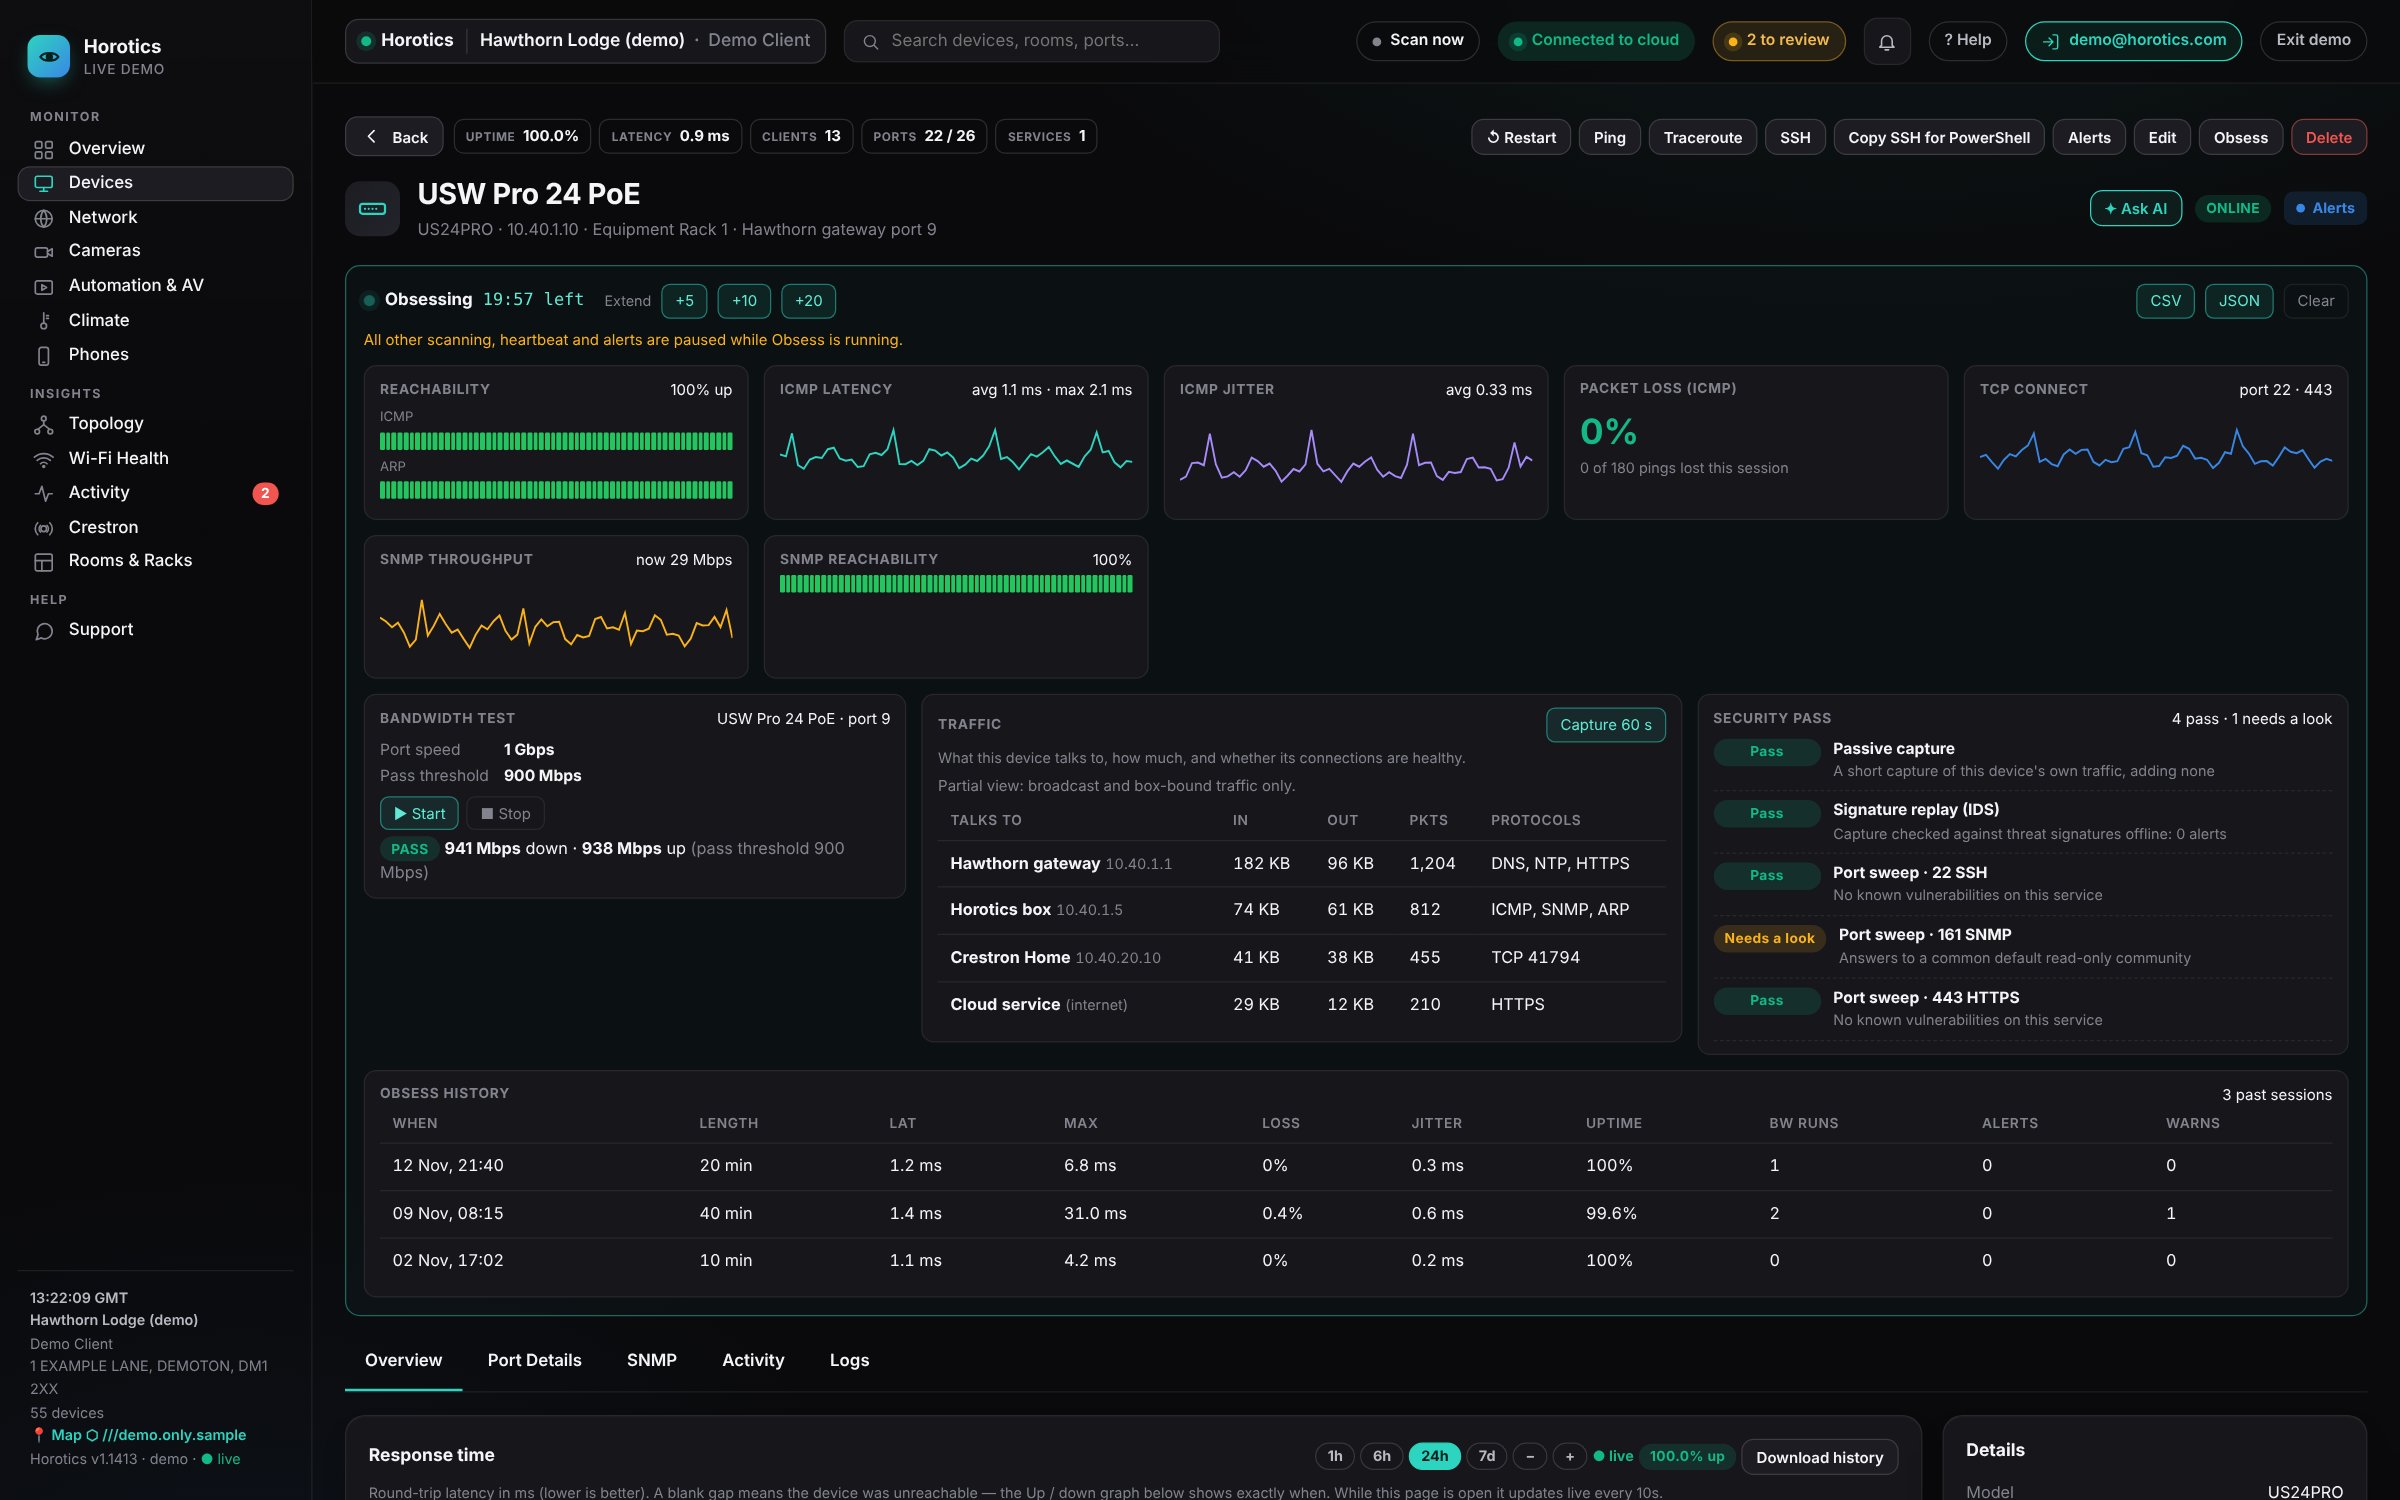
Most of the time Horotics checks every device every few seconds. That's perfect for spotting something that's down, but a device that's only "sort of" fine (a TV that drops out once an evening, a camera that freezes now and then) can slip between checks.
Obsess is for those. Point it at one device for a set time and the box stops everything else and puts all its attention on that device. You get a minute-by-minute picture of how it's behaving, a speed test, a look at what it's talking to and a security check, all saved so you can compare with next time.
Starting it

- Open the device's own page and press Obsess in the tools row along the top.
- Choose how long: 5, 10, 20 or 40 minutes. Press Cancel if you change your mind.
- The Obsess panel opens under the device's name and starts filling in straight away.
Worth knowing: while Obsess runs, all other scanning, heartbeats and alerts on the box are paused, so it can give this one device its full attention. Keep sessions as short as you need, and pick a quiet time if you can.
While it's running

- Obsessing and time left
- The pulsing dot shows it's running, with a countdown.
- Extend +5 / +10 / +20
- Add more time without starting again, handy if the fault hasn't shown up yet.
- CSV and JSON
- Download everything collected in this session, for a spreadsheet or to send to a manufacturer's support team.
- Clear
- Stop the session now. Normal monitoring and alerts carry on straight away.
The live graphs
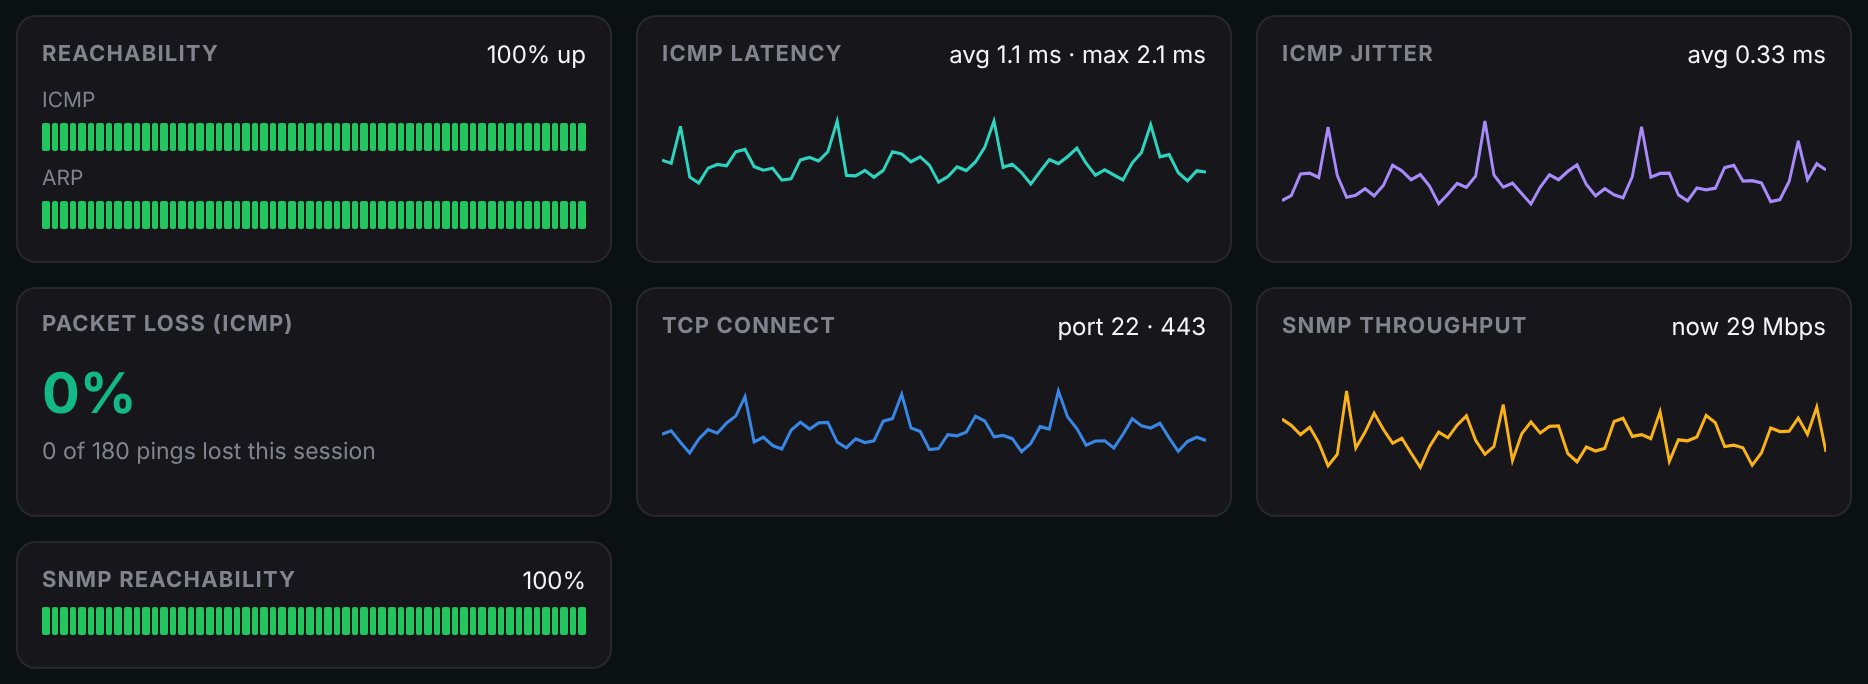
Each box is one measurement, updated every few seconds. The figure in the top corner is the summary so far.
- Reachability
- A strip for each way the box can reach the device: ICMP (ping) and ARP (the network's own "who's there?"). Green means it answered, red means it didn't. A row of red slivers is exactly the sort of brief dropout normal monitoring can miss.
- ICMP latency
- How long the device takes to answer, in milliseconds, with the average and the worst. Lower and flatter is better. Spikes are moments it was slow to answer.
- ICMP jitter
- How much the answer time varies from one ping to the next. Low jitter matters for anything live, such as audio, video, intercoms and control. Steady is good, even if not the fastest.
- Packet loss (ICMP)
- The share of pings that never came back this session. 0% is what you want. Anything above it on a wired device is worth chasing.
- TCP connect
- How quickly the device's own services (such as its web page or control port) accept a connection. A device can answer pings but still be too busy to accept connections; this catches that.
- SNMP throughput
- On managed equipment such as switches and access points: how much traffic is actually flowing, read from the device's own counters.
- SNMP reachability
- Whether the device's management side answers every time, separate from whether it answers pings.
Bandwidth test
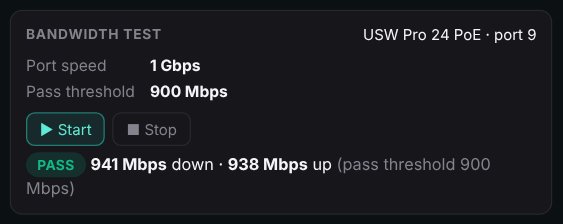
A real speed test through the device's own switch port. Horotics finds which switch port the device is on and that port's speed, and sets a pass threshold just below it (for example 900 Mbps on a 1 Gbps port). Press ▶ Start to push traffic through for a few seconds, or ■ Stop to end it early.
The result is PASS or FAIL, with the speed achieved each way. A port that should do 1 Gbps but only manages 100 Mbps usually means a damaged cable, a bad termination or a port that has dropped to a lower speed: invisible to normal monitoring, obvious here.
Traffic
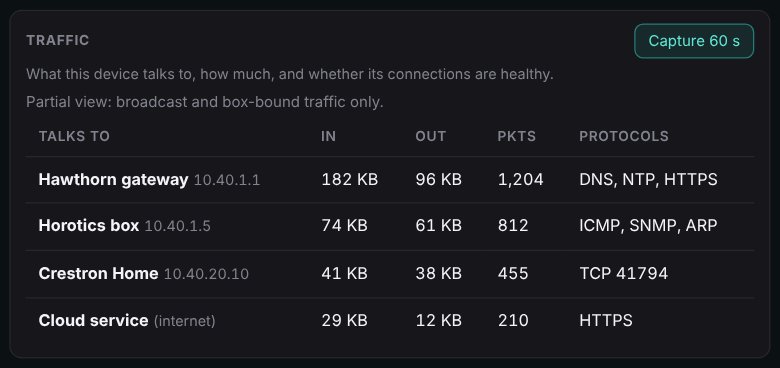
For 60 seconds the box listens to this device and lists what it talks to, how much went in and out, the number of packets, and the protocols used. It starts automatically with the session; press Capture 60 s to take another.
It answers questions like "why is this device so busy?" or "is it talking to something it shouldn't?". Full view means the switch copied all of this device's traffic to the box; Partial view means only broadcast traffic and traffic to the box could be seen.
Security pass
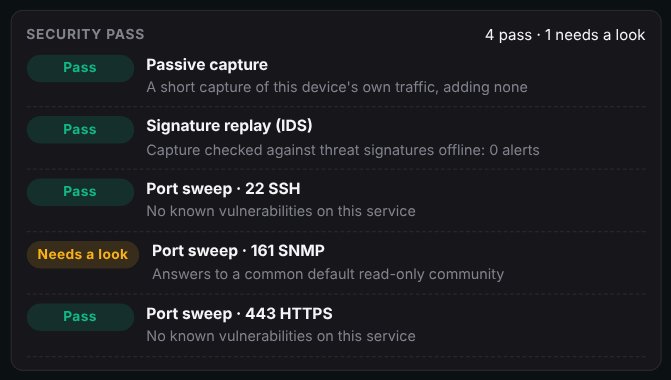
A security check that runs alongside every session, without you having to start it. It doesn't change anything on the device:
- Passive capture
- A short recording of the device's own traffic, taken without sending it anything.
- Signature replay (IDS)
- That recording is checked, offline on the box, against a library of known attack and malware patterns.
- Port sweep
- Each service the device offers (its open ports) is checked for known vulnerabilities and weak settings, such as a default password or community string.
Each line shows Pass or Needs a look, with a one-line reason. "Needs a look" isn't an alarm; it's something your installer should check and tidy up.
Obsess history
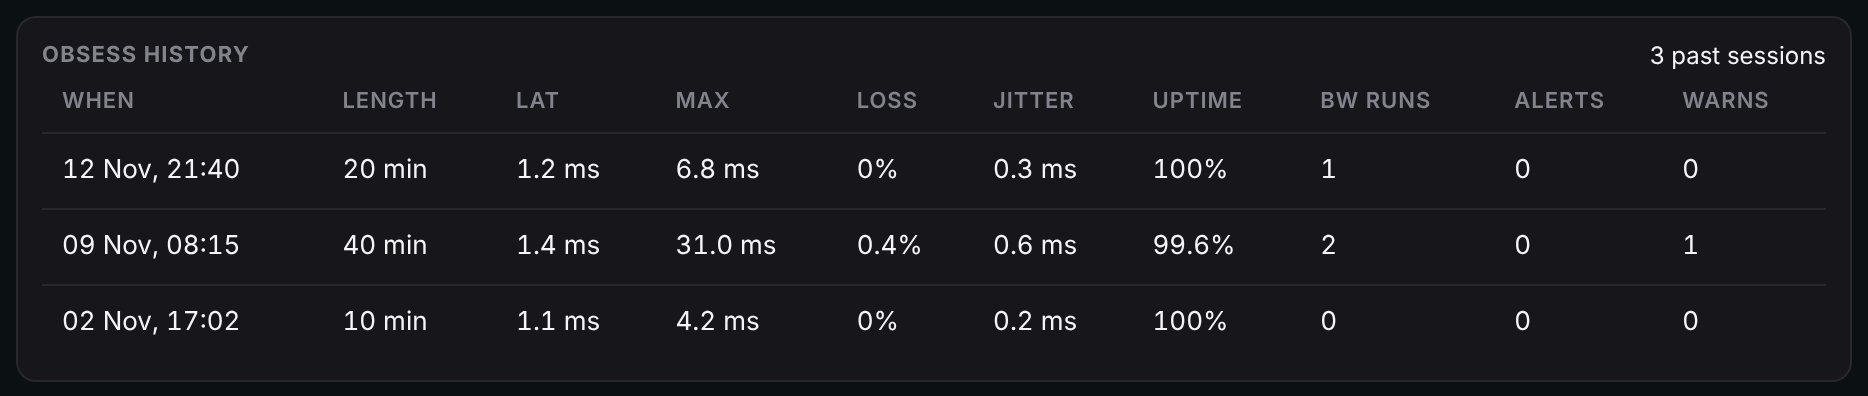
Every session is saved, up to the 50 most recent per device, and kept through restarts and updates. Each row shows when it ran and for how long, then Lat and Max (average and worst response time), Loss, Jitter, Uptime, how many bandwidth tests were run, and any Alerts and Warns raised.
This is what makes Obsess useful for faults that come and go: you can show that a device was perfect on Monday and dropping packets on Thursday, rather than relying on whoever happened to be looking.
Ask AI
The ✦ Ask AI button next to the device's status gives a plain-English, read-only look at this device's Obsess history and logs, with suggestions. It's advice only: nothing is run or changed.
When to use it
- A device that drops out now and then but always seems fine when you look.
- Something that feels slow: check its latency, jitter and bandwidth test.
- After a fix, to prove it worked: run a session and compare with the one before.
- A new or unknown device on the network: see what it talks to and run the security pass.
Try it in the live demo: open a device, press Obsess, and pick a time. The demo shows made-up results and nothing is really tested.