Your dashboard (Overview)
Your home page: is everything OK? See it in the live demo →
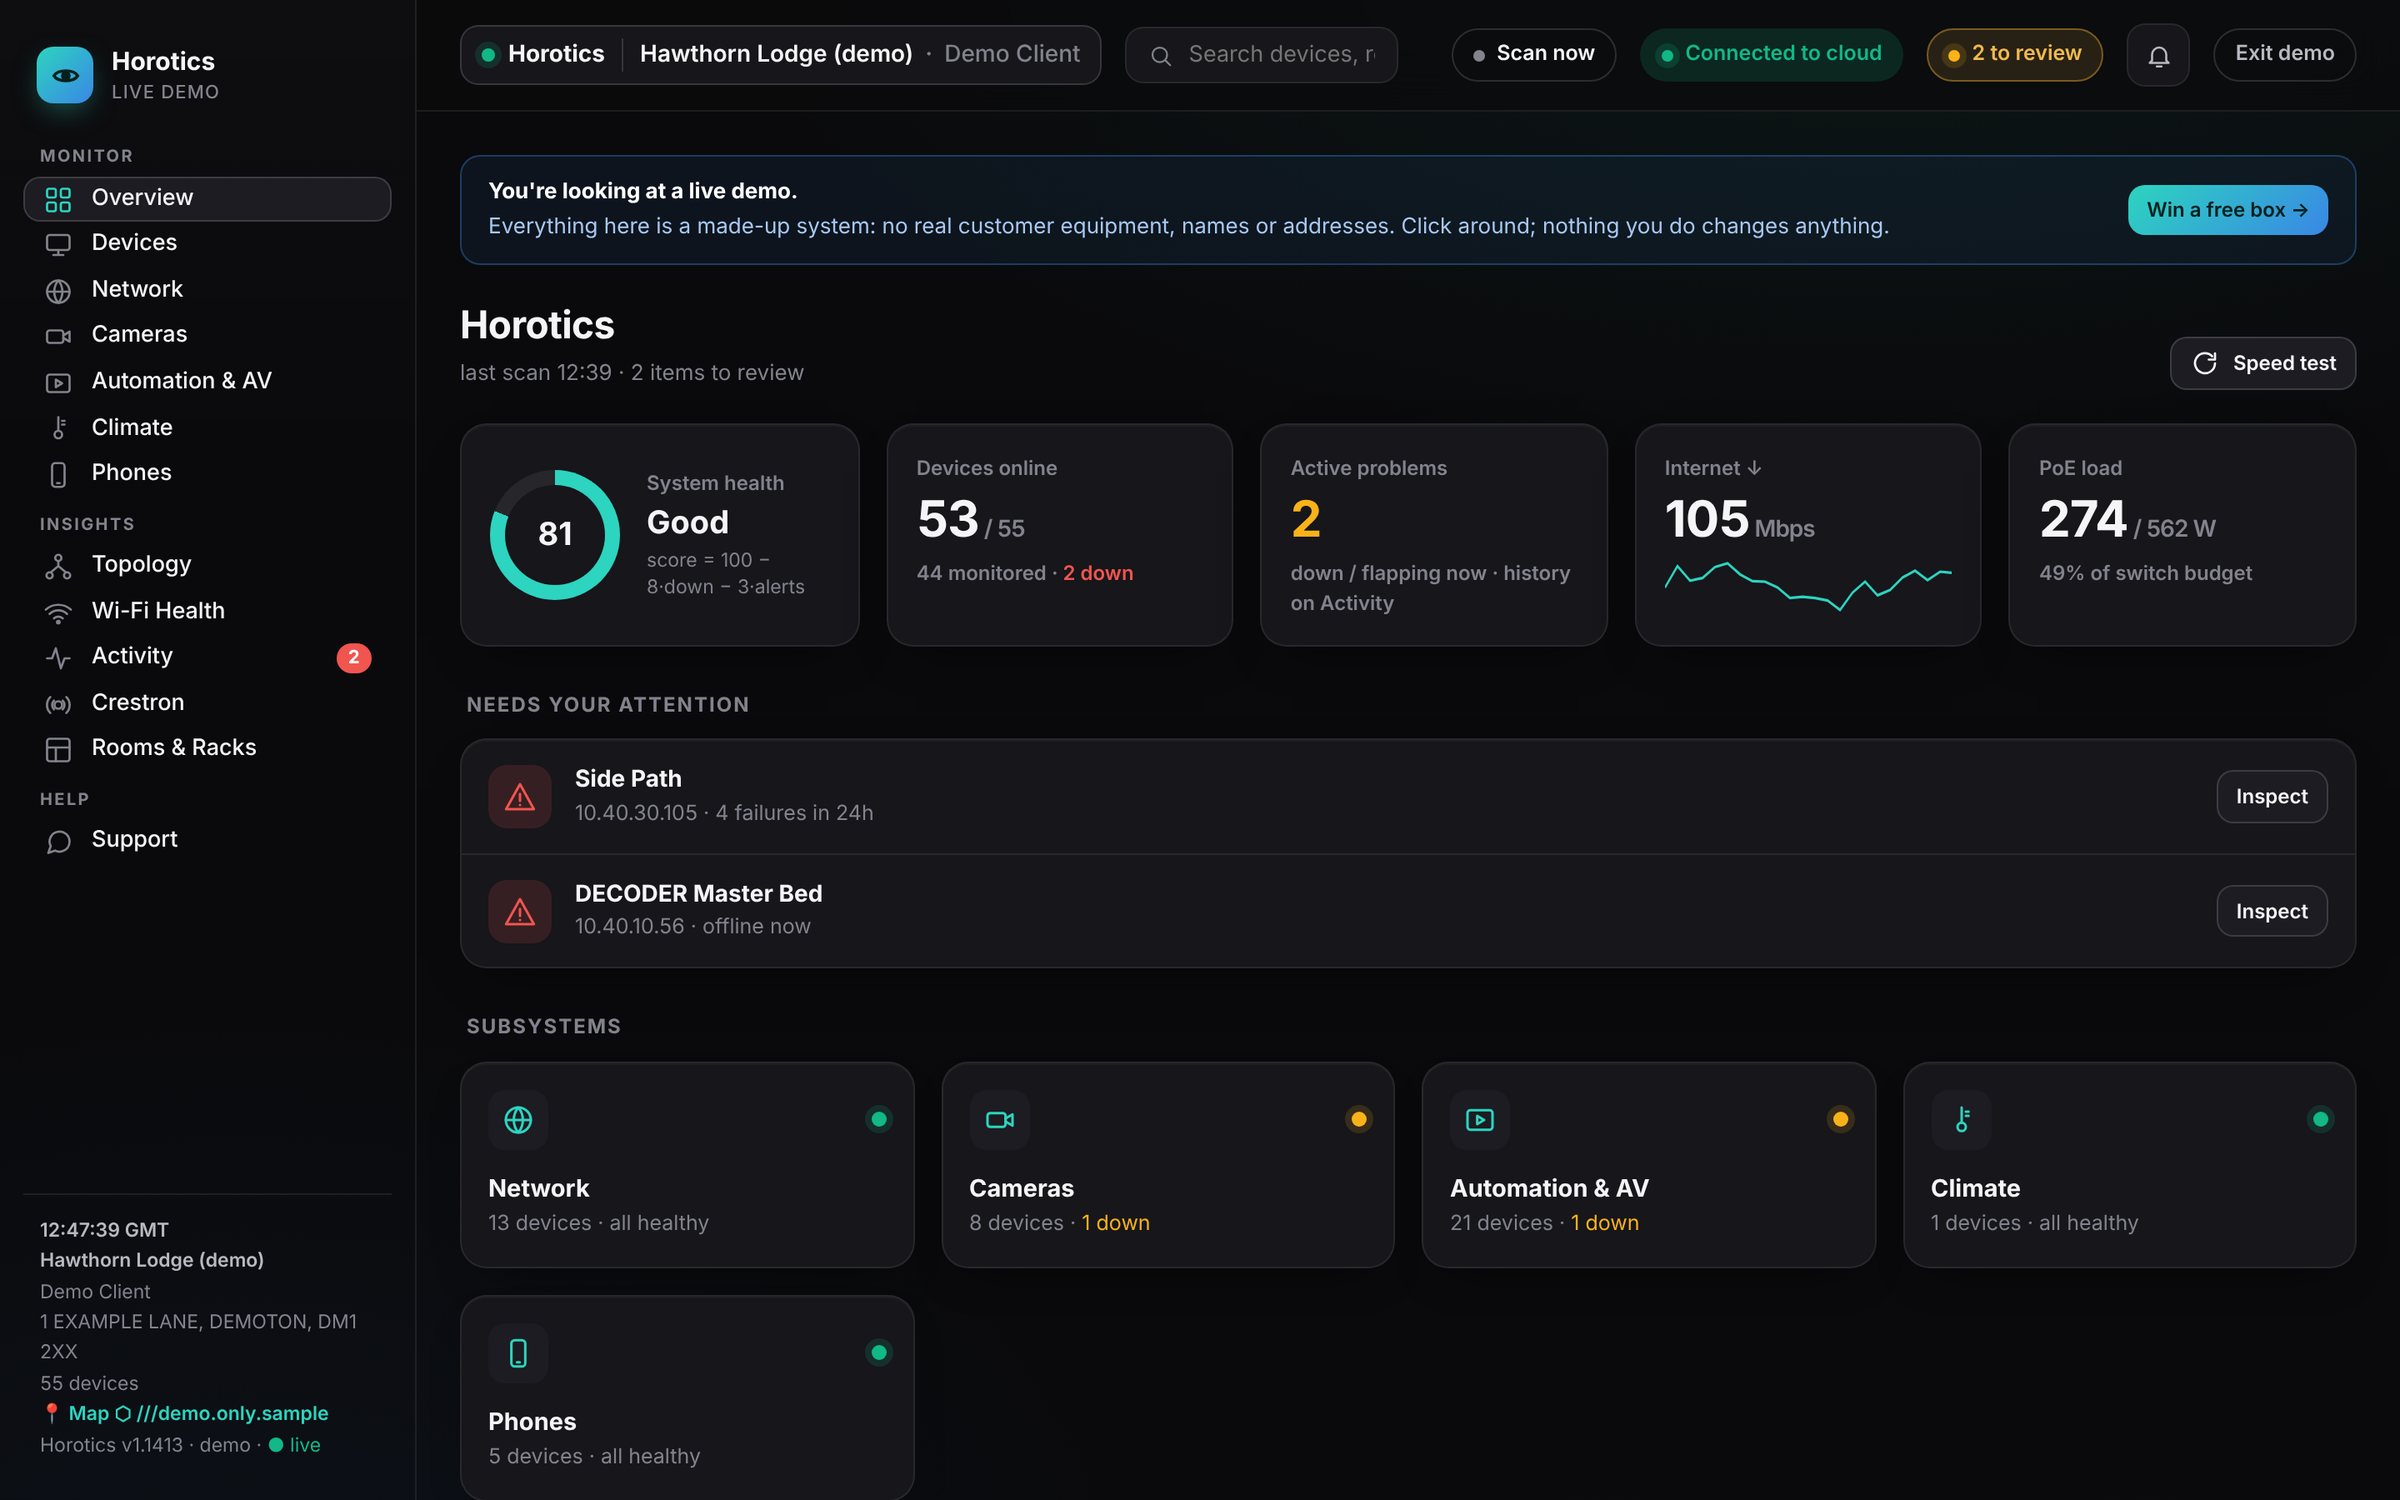
The Overview is your home page. One glance tells you whether your system is happy.
The menu on the left
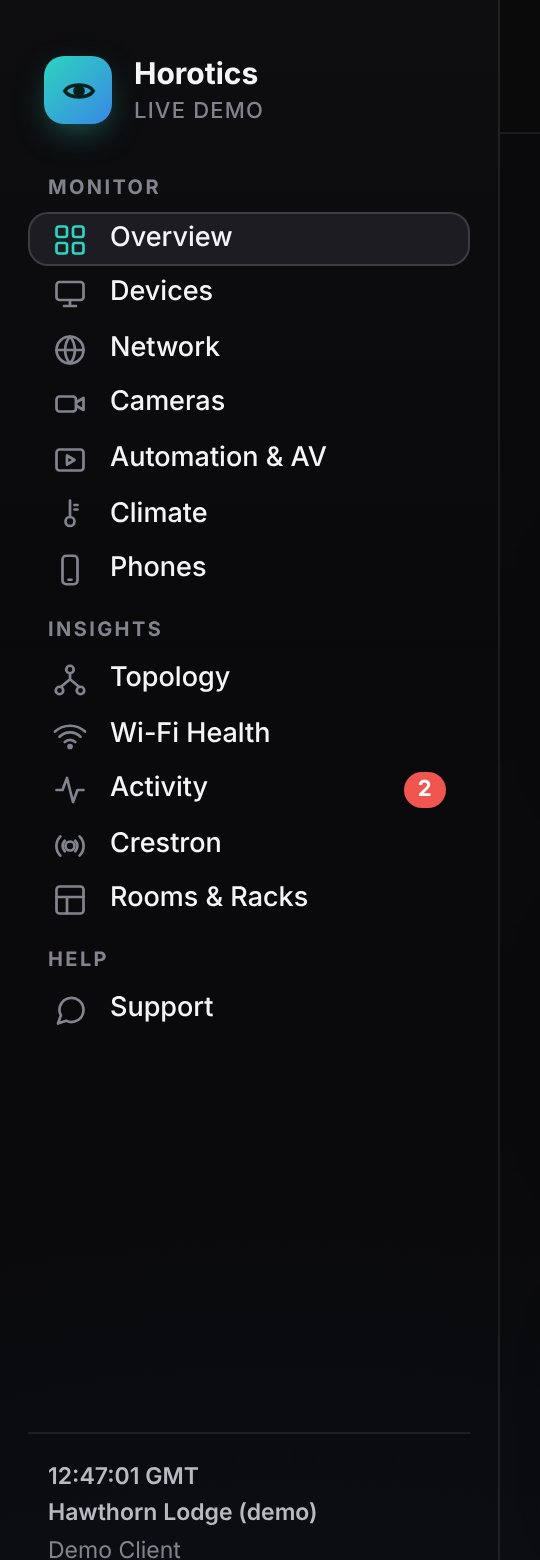
The same on every page, so once you know it, you know the whole system. The page you're on is highlighted.
- Monitor
- Everyday views of your equipment: Overview, Devices (everything), then each group on its own: Network, Cameras, Automation & AV, Climate and any others set up for your site, such as Phones.
- Insights
- Whole-system views: Topology (what's plugged into what), Wi-Fi Health, Activity (everything that's happened; a red number counts new alerts), Crestron on sites with Crestron, and Rooms & Racks.
- Help
- Support shows how to get help.
- At the bottom
- The time, your site's name, address and device count, a map link, and the box's software version.
Installers also see admin pages such as Notifications, Diagnostics and Cloud backup.
The strip along the top

- Site name
- Which site you're looking at, and who it belongs to.
- Scan now
- Asks the box to look for new or changed devices straight away, instead of waiting for its next routine scan.
- Connected to cloud
- The box is online and sending alerts. If this changes, the box has lost its internet connection; it keeps watching locally and catches up when it reconnects.
- N to review
- How many alerts you haven't looked at yet. Click it to go to Activity.
The five figures

- System health
- One score out of 100 with a word beside it (Excellent, Good, Fair or Poor). Each device that's down or alert that's active takes a few points off.
- Devices online
- How many devices are answering, out of the total. Underneath: how many are monitored and how many of those are down.
- Active problems
- Things that are down or dropping in and out right now. Zero is green.
- Internet ↓
- Your latest broadband download speed.
- PoE load
- How much power your switches are sending down network cables to things like cameras and Wi-Fi points, against what they can supply. A high percentage means a switch is near its limit.
Needs your attention

A short list of anything down or unreliable, newest first, with the reason (for example "4 failures in 24h" or "offline now"). Press Inspect to open that device. When nothing's wrong, it says so.
Subsystems
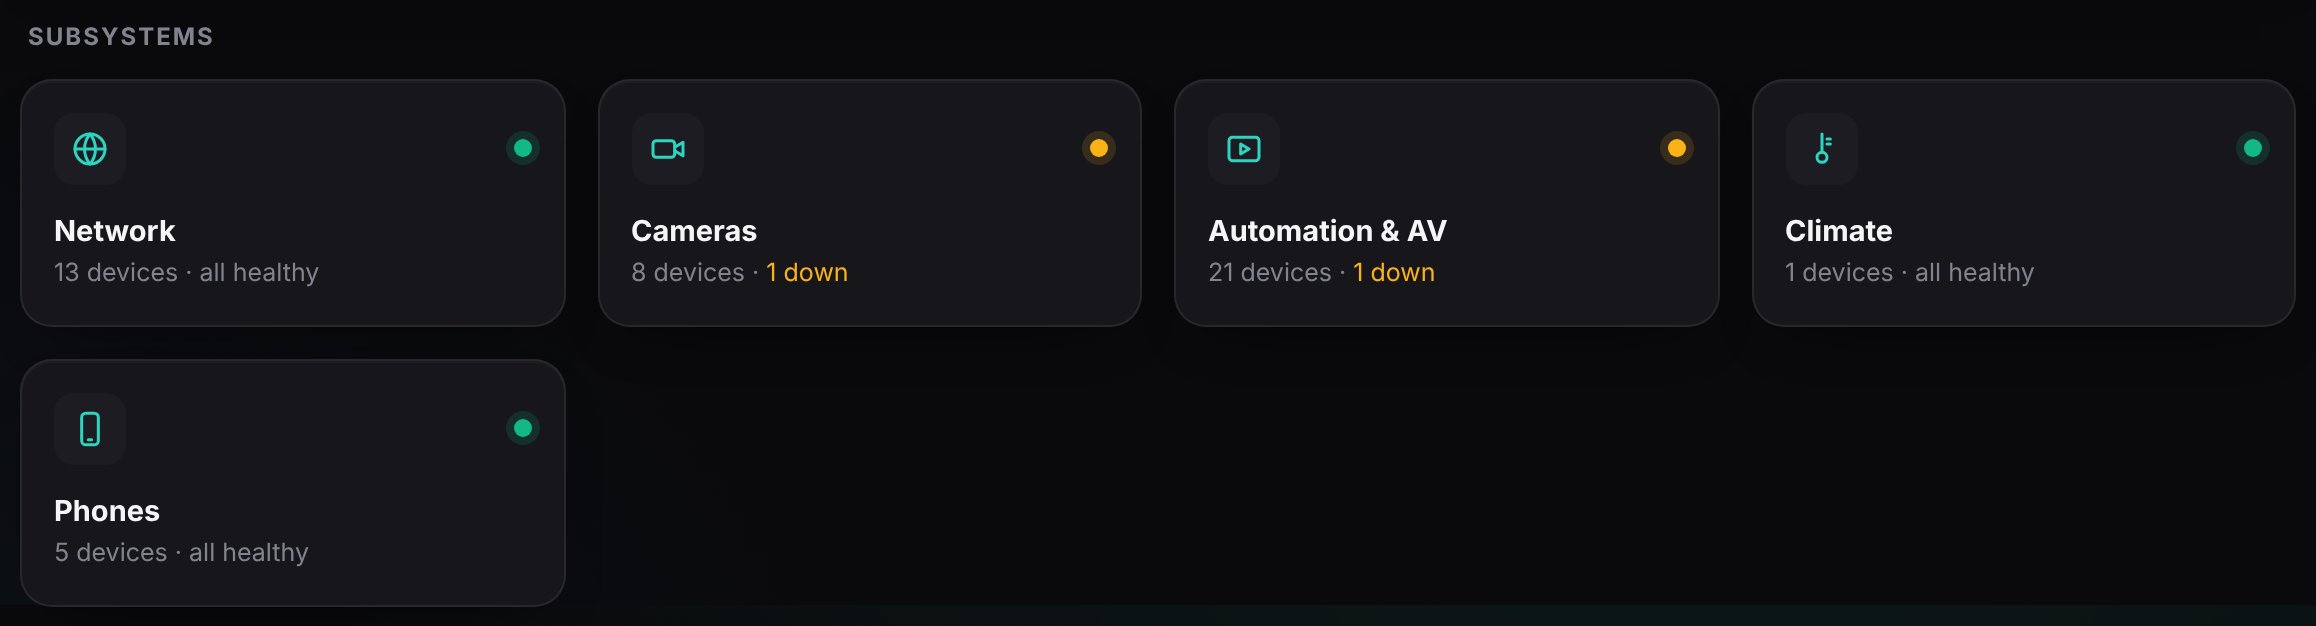
Your system in simple groups. Each tile shows how many devices it has and whether they're all healthy, or how many are down. Click a tile to open that group.
Internet: last 24 hours
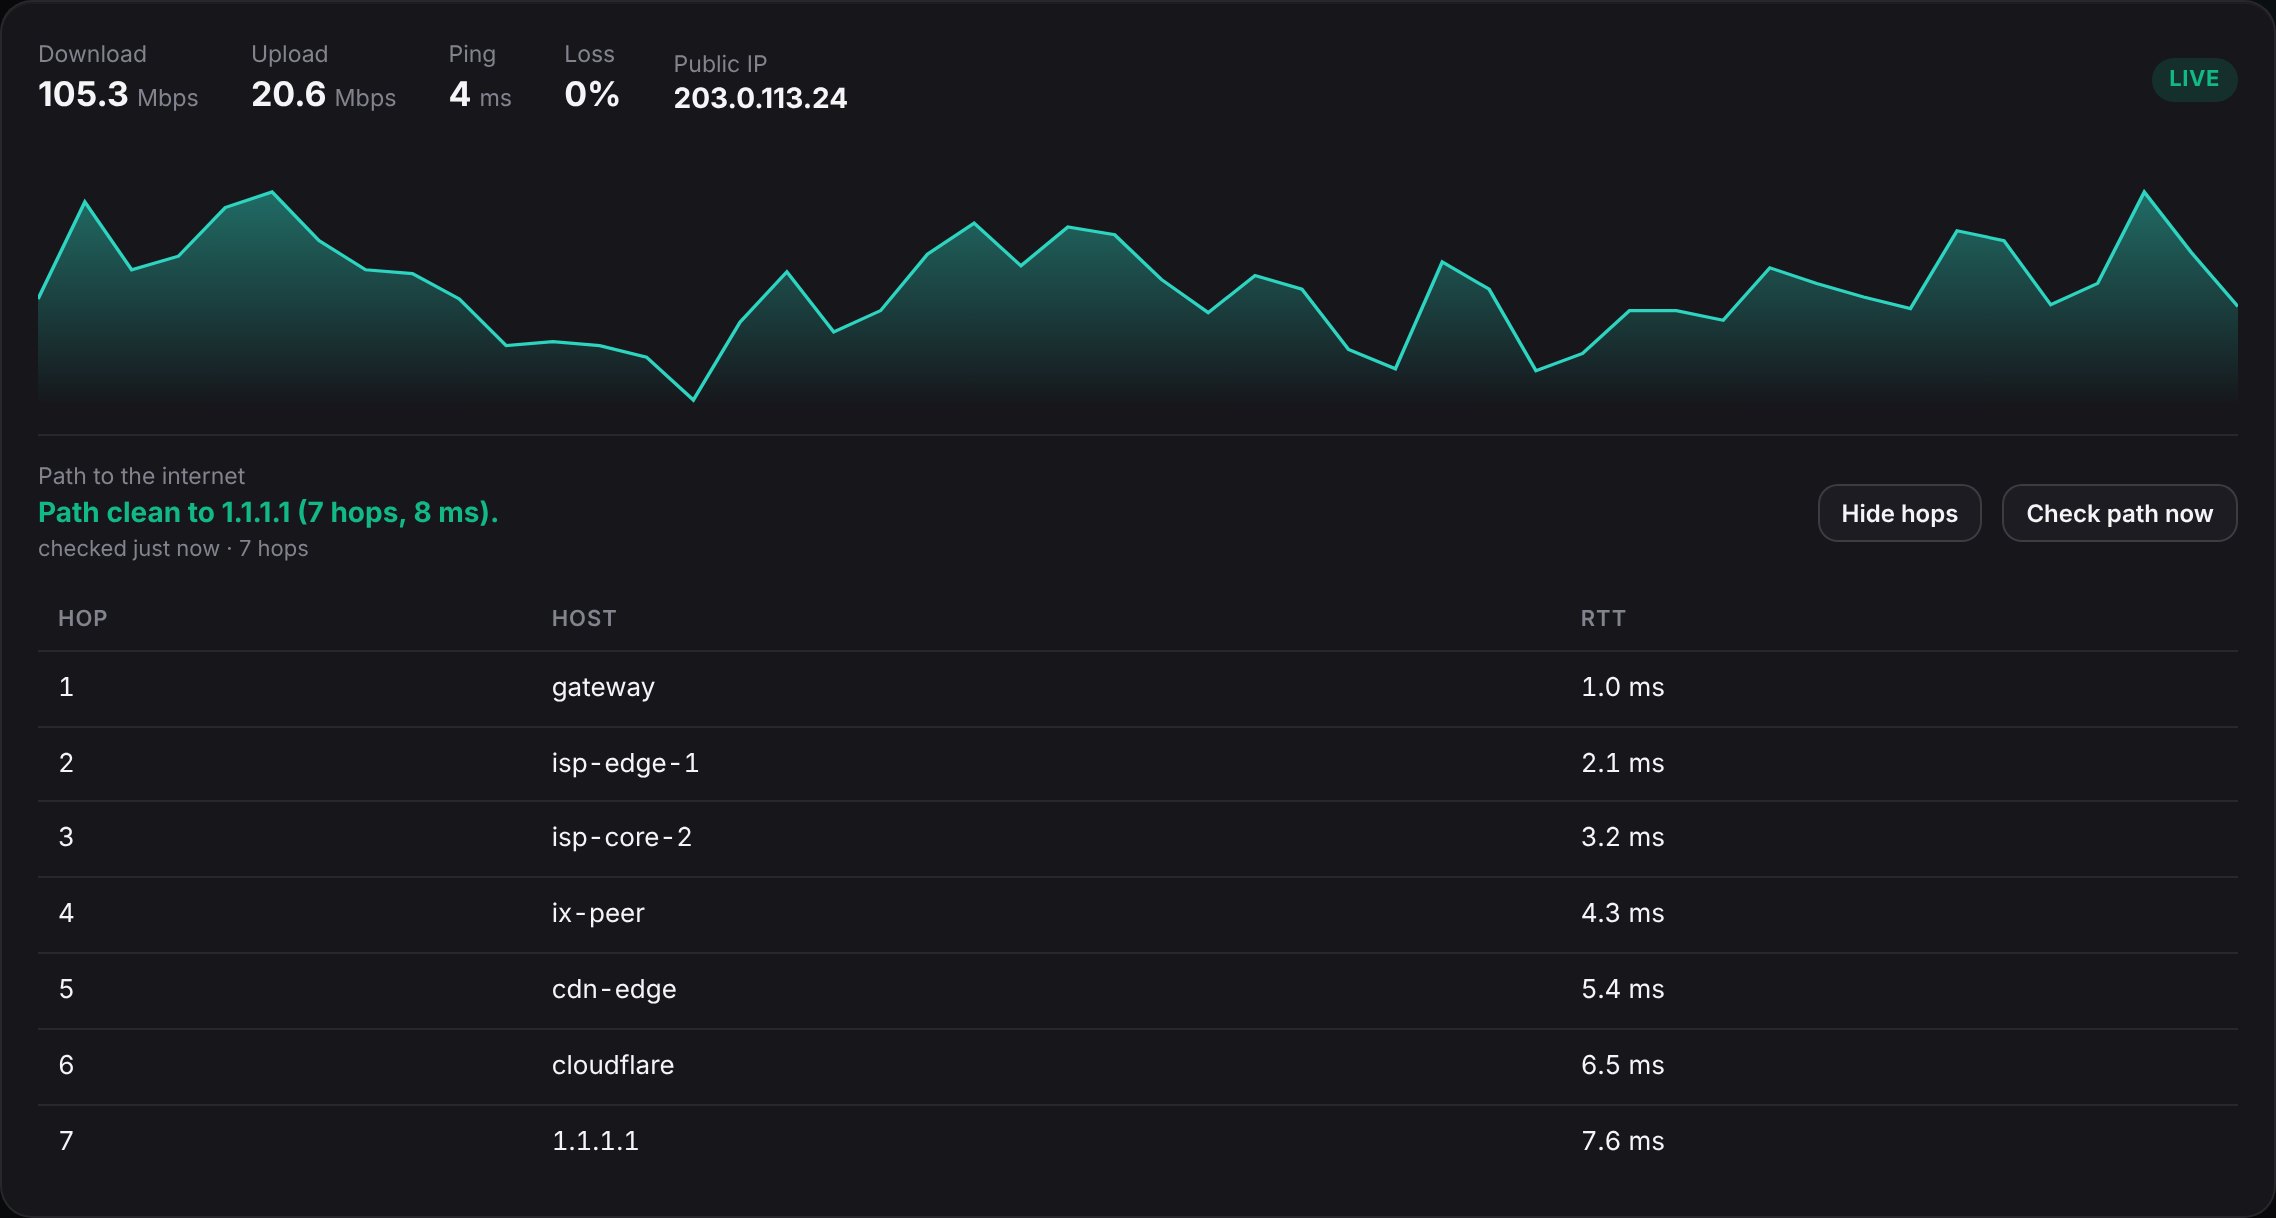
- Download and Upload
- Your broadband speed from the box's latest speed test.
- Ping
- How quickly the internet answers, in milliseconds (ms). Lower is better: under about 20 ms is excellent.
- Loss
- The share of test data that never came back. It should be 0%.
- Public IP
- Your site's address on the internet.
- The graph
- Your download speed over the last 24 hours. Dips show when your connection slowed. The full 30-day history is on the Activity page.
Path to the internet
This checks the route your internet traffic takes from your site out to 1.1.1.1, a public address run by Cloudflare that is always on, which makes it a reliable test target. "Path clean to 1.1.1.1 (7 hops, 8 ms)" means the test reached it in 7 steps, taking 8 ms, with no data lost along the way.
Press Show hops to see each step, and Check path now to run the test again.
What the hops mean
Your internet traffic doesn't travel in one jump. It's passed along a chain of routers, a bit like a parcel moving between sorting offices. Each router is one hop.
- Hop
- The step number. Hop 1 is your own router (the gateway). The next few are usually your internet provider's network. After that come the links between networks, and finally the destination.
- Host
- The name or address of the router at that step.
- RTT (round-trip time)
- How long a test message took to reach that router and come back. It normally rises a little at each hop as the distance grows.
The number of hops doesn't matter much. What matters is the time at the last hop and whether any data is lost.
Why you might see loss (for example "50% loss")
The key is where the loss appears, and whether it carries on to the last hop.
- Loss at a middle hop only, with 0% at the last hop: usually nothing to worry about
- Many internet routers are busy forwarding traffic and give a low priority to answering test messages. They may ignore half of them and show "50% loss", while your real traffic passes through perfectly. If the final hop shows no loss, your connection is fine.
- Loss that starts at one hop and continues all the way to the end: real loss
- Data really is being dropped at or just before that hop. Where it starts tells you where to look:
- From hop 1 (your router): the problem is on site. Typical causes are an overloaded or faulty router, a bad cable or switch port between the box and the router, or a network loop.
- From hop 2 (the first hop at your provider): the problem is your internet line. Typical causes are a fault on the broadband line, a loose cable to the modem or fibre box, or your provider's equipment.
- Further out: the problem is in your provider's wider network or beyond. These are usually temporary and outside your control.
- Loss only when the connection is busy
- If loss appears when large uploads or downloads are running (cloud CCTV recording, backups, big updates), the line is full. Data queues up and some is dropped.
Reading your own results: a worked example
Here is a typical result that looks alarming but isn't. The top-line Loss on the dashboard reads 0%.
| Hop | Host | RTT | Loss |
|---|---|---|---|
| 1 | Your router (gateway) | 1 ms | 50% |
| 2 | Your provider | 3 ms | 0% |
| 3 | Your provider | * | no reply |
| 4 | Your provider | 5 ms | 0% |
| 5 | Internet exchange | 6 ms | 0% |
| 6 | Cloudflare | 7 ms | 0% |
| 7 | Cloudflare | 8 ms | 0% |
| 8 | 1.1.1.1 (destination) | 8 ms | 0% |
- Start at the last hop. The destination, hop 8 (1.1.1.1), shows 0% loss, and so does the top-line Loss figure. That alone tells you your connection is fine.
- Check the hops after the one showing loss. Every message to hops 2 to 8 has to pass through hop 1 first. If hop 1 were really losing 50%, hops 2 to 8 would all show about 50% or more. They show 0%.
- So the 50% at hop 1 isn't real loss. Your router is simply busy and doesn't bother answering every test message aimed at it, while it passes your real traffic through perfectly.
- A hop showing "*" or "no reply" (hop 3 here) is the same thing: that router doesn't answer tests at all. As long as later hops answer, ignore it.
Compare that with real loss. Here it starts at hop 2 and carries on all the way to the destination, and the top-line Loss also shows about 30%:
| Hop | Host | RTT | Loss |
|---|---|---|---|
| 1 | Your router (gateway) | 1 ms | 0% |
| 2 | Your provider | 14 ms | 30% |
| 3 | Your provider | 15 ms | 31% |
| 4 | Your provider | 17 ms | 29% |
| 5 | Internet exchange | 18 ms | 30% |
| 6 | Cloudflare | 19 ms | 31% |
| 7 | Cloudflare | 20 ms | 30% |
| 8 | 1.1.1.1 (destination) | 20 ms | 30% |
Because the loss continues to the last hop, it's genuine. It starts at hop 2, the first hop at your provider, so the problem is most likely your internet line. See what to do about it.
The rule of thumb: loss only matters if it carries on to the last hop. Loss that appears at one hop and then disappears is just a busy router.
What loss means for the network
When data is lost, devices have to send it again, which costs time. Even 1–2% loss is noticeable:
- web pages load slowly or stall
- video calls freeze or break up
- streaming and music services buffer or drop out
- remote access to the site feels laggy, and alerts can arrive late
Real loss of 50% would make the internet close to unusable, which is another sign that a 50% figure at a middle hop alone is usually just a router ignoring tests.
What to do about it
- Press Check path now to run the test again. A single bad reading can be a blip.
- Look at the last hop. If it shows 0% loss, ignore loss at middle hops.
- If loss starts at hop 1, restart the router and check the cables and switch port between the box and the router. If it keeps happening, ask your installer to investigate the site network.
- If loss starts at hop 2, check the cable to the modem or fibre box, restart them, and if it continues, contact your internet provider. A screenshot of the hops helps them.
- If it only happens at busy times, check the Activity speed history for a pattern and talk to your installer about traffic management or a faster line.
The one thing to remember: if everything is green, you don't need to do anything. Horotics is watching so you don't have to.