The Devices list
Everything Horotics is watching. See it in the live demo →
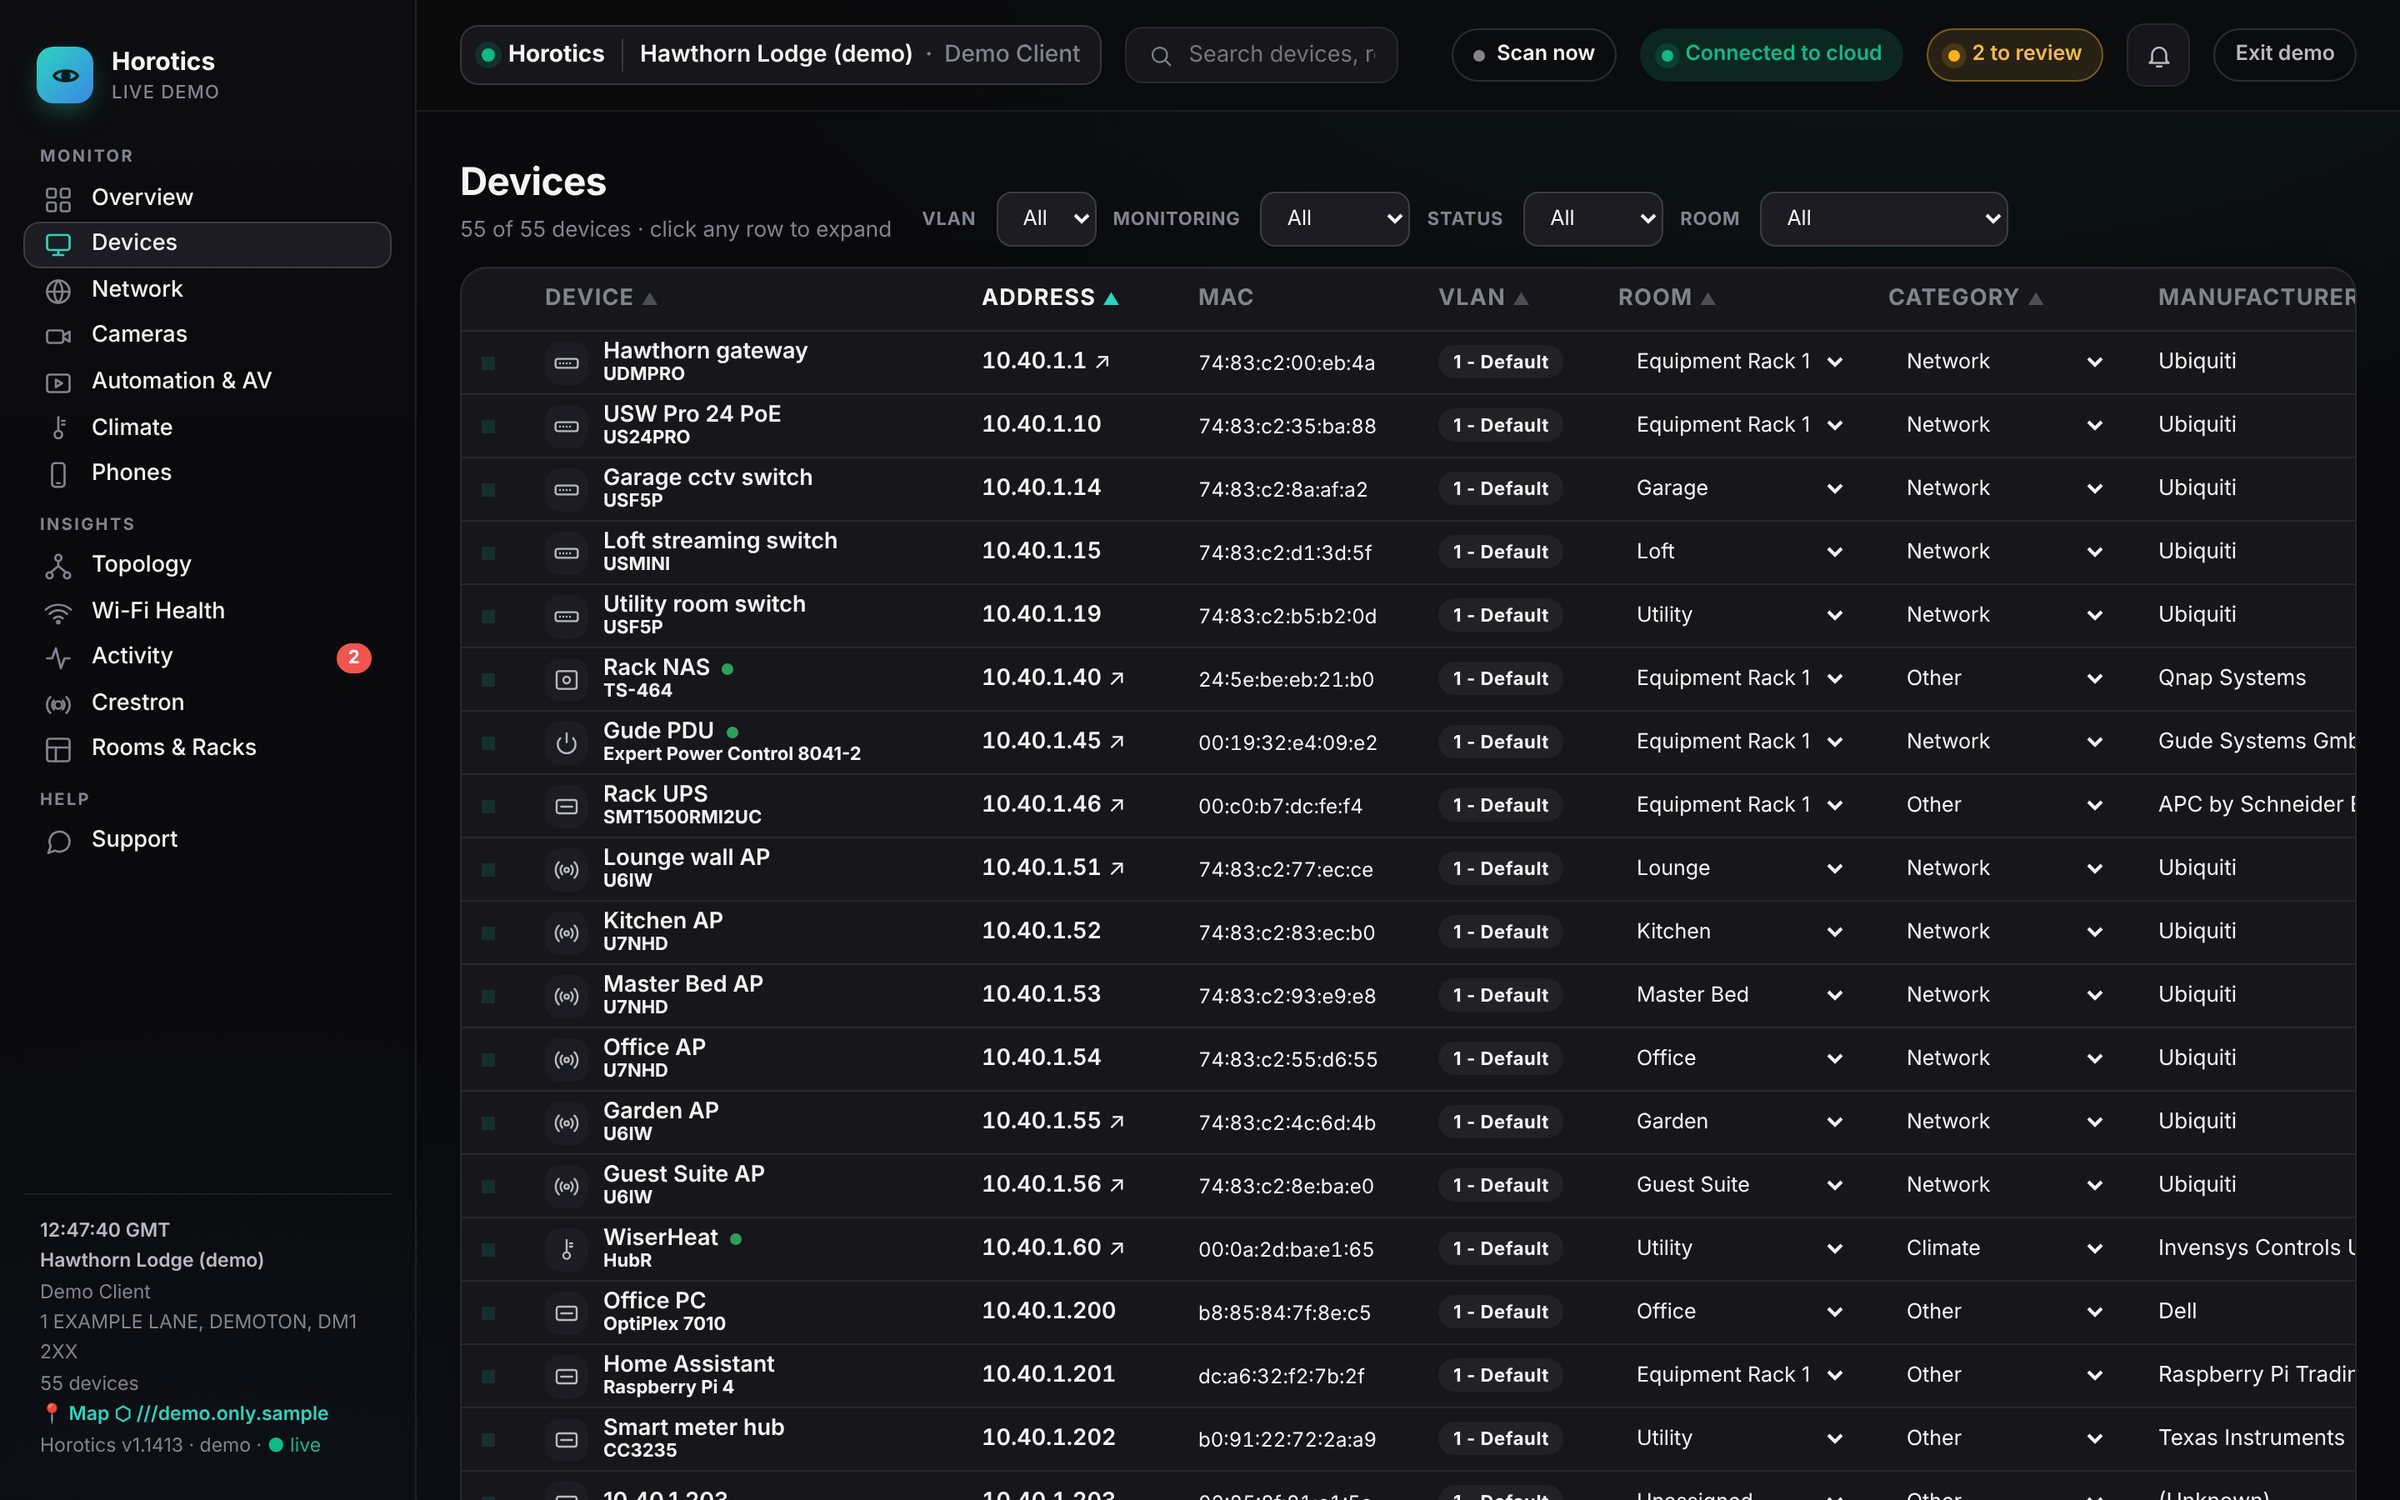
Every piece of equipment Horotics knows about (TVs, speakers, cameras, switches, heating, the lot), one row each.
The filters

Pick from any of the four and they combine. They only change what's shown, never your equipment. The count under the title shows how many devices match.
- VLAN
- Only devices on one network "lane", for example AV or CCTV.
- Monitoring
- Only devices with one monitoring setting: Off (left alone), Monitor (watched and recorded, but no alerts) or Alerts (watched, and you're told if it goes down). More about the monitoring setting.
- Status
- Only online or only offline devices.
- Room
- Only the equipment in one room.
The columns
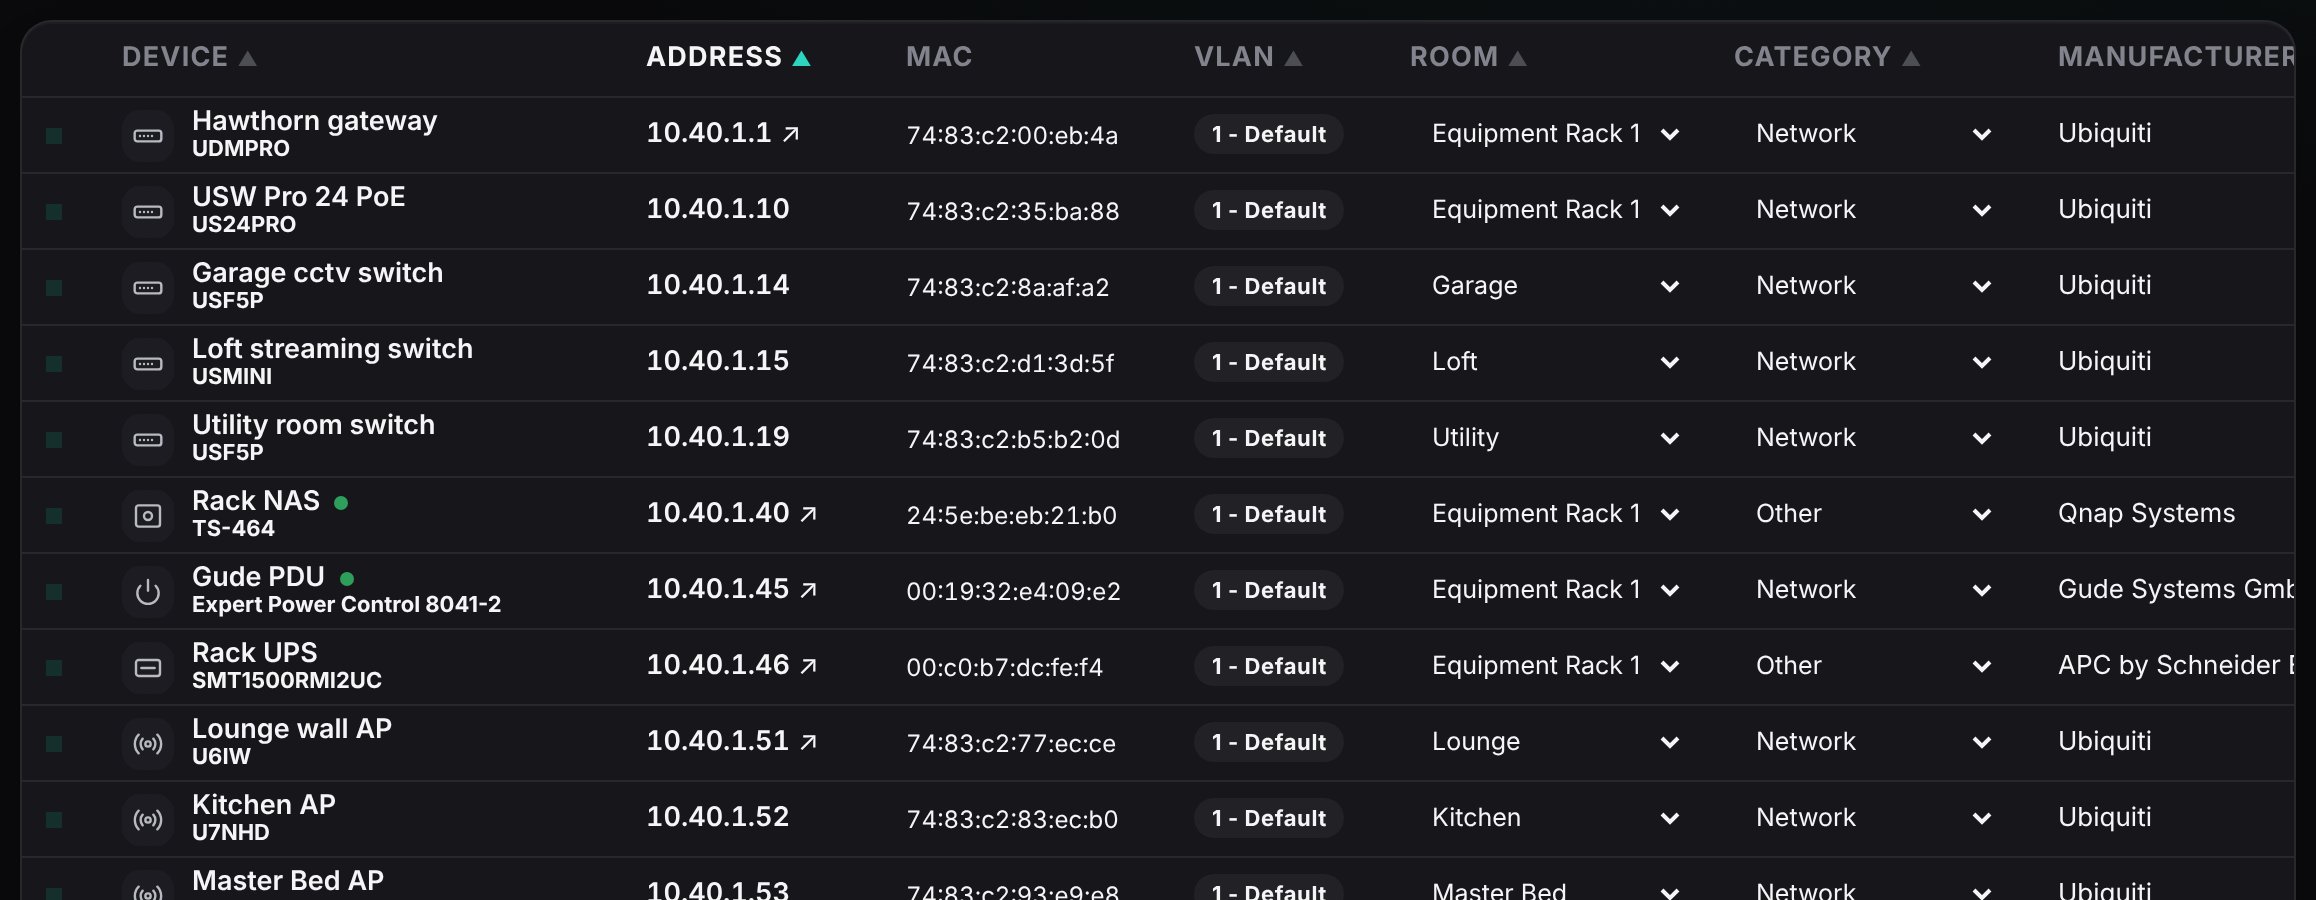
- Device
- Its name, with the model underneath. Click the name to open its page.
- Address
- Its IP address on your network. The ↗ arrow opens the device's own web page, where it has one.
- MAC
- Its permanent hardware ID, which never changes even if the IP address does.
- VLAN
- Which network lane it's on.
- Room and Category
- Where it is and what kind of thing it is. Horotics fills these in automatically; change them from the drop-downs if it's got one wrong.
- Manufacturer
- Who makes it.
- Open ports
- The services it offers on the network, such as a web page or a video stream. Mostly of interest to installers.
- Monitoring
- Alerts: watched, and you're told if it goes down. Monitor: watched and recorded, but no alerts. Off: left alone.
- Status
- HEALTHY: working. OFFLINE: not answering, but not something you've asked to be alerted about, like a TV that's switched off. DOWN (red): a monitored device that should be answering but isn't.
Opening a device
Click a row to open a drop-down panel underneath it with more detail; click again to close it. Only one panel is open at a time. Click the device's name to go to its own page instead.
The drop-down panel
The panel changes with the type of device, so you see what matters for that kind of equipment. Every panel ends with two buttons: Full details → opens the device's own page, and Edit device changes its name, room, category or monitoring. Most also show Connected to: the switch and port it's plugged into, or Wi-Fi.
Switches and the gateway
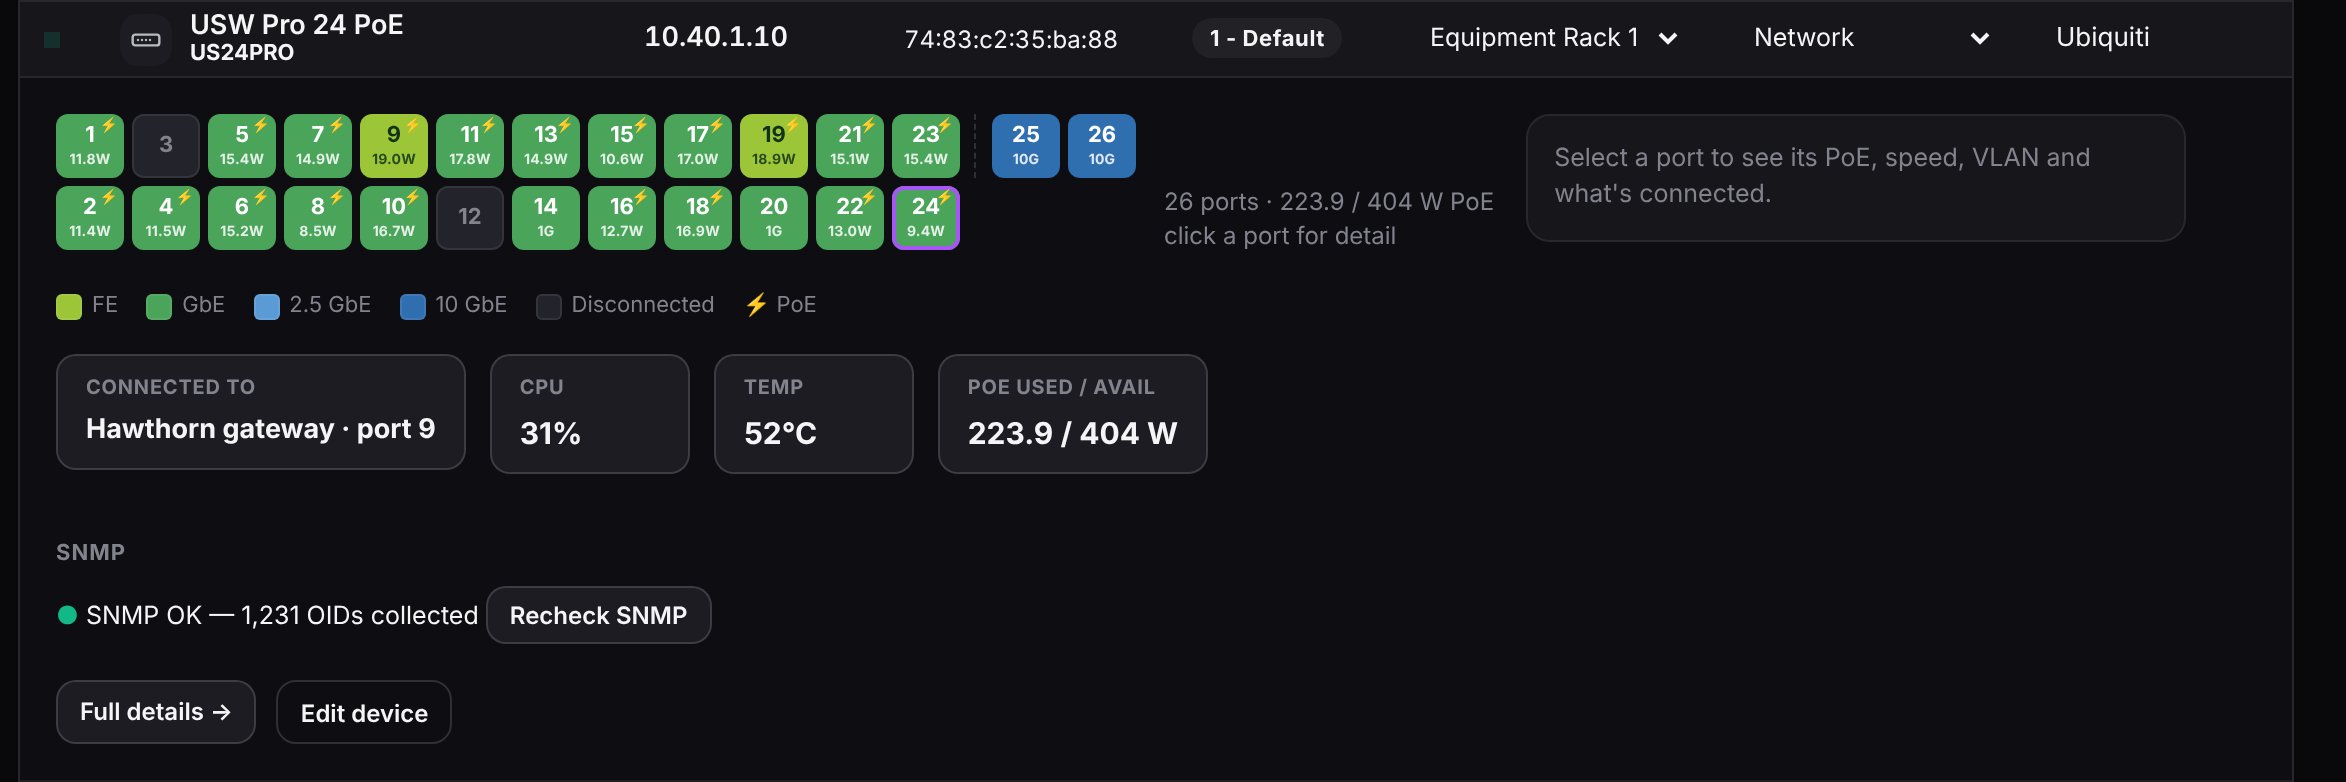
- Port picture
- Every port as it looks on the front. Coloured ports are in use, with the colour showing the speed (FE, GbE, 2.5 GbE, 10 GbE) and ⚡ with the wattage where it's powering something. Grey ports are empty. Click a port to see its speed, power, VLAN and what's plugged into it.
- CPU, Temp and PoE used / avail
- How hard the switch is working, how warm it is, and how much of its power budget is in use. If PoE used gets close to available, there's no power left for more cameras or access points.
- SNMP
- Whether the box is reading the switch's own figures, with Recheck SNMP to try again. SNMP data arrives as raw codes; Horotics turns it into the port picture and figures you see here instead of lines of code.
Wi-Fi access points
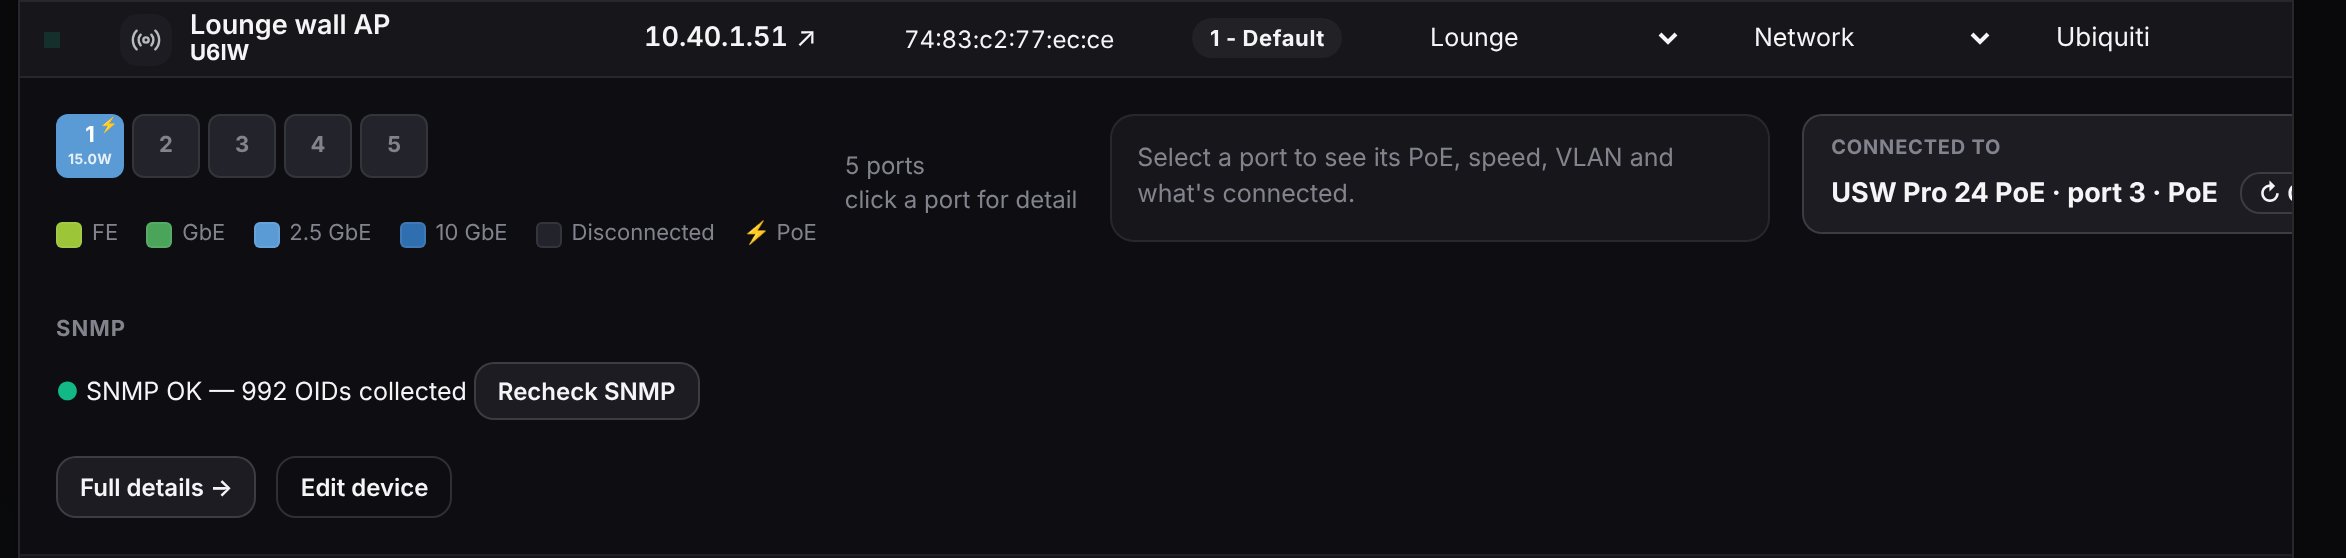
Like a switch, but smaller: its ports (usually one, which is also its power), the switch port it's plugged into, and SNMP. Where it's powered over the cable, ↻ Cycle PoE turns the power to it off and on again, which restarts it. It asks first and takes about a minute.
Crestron
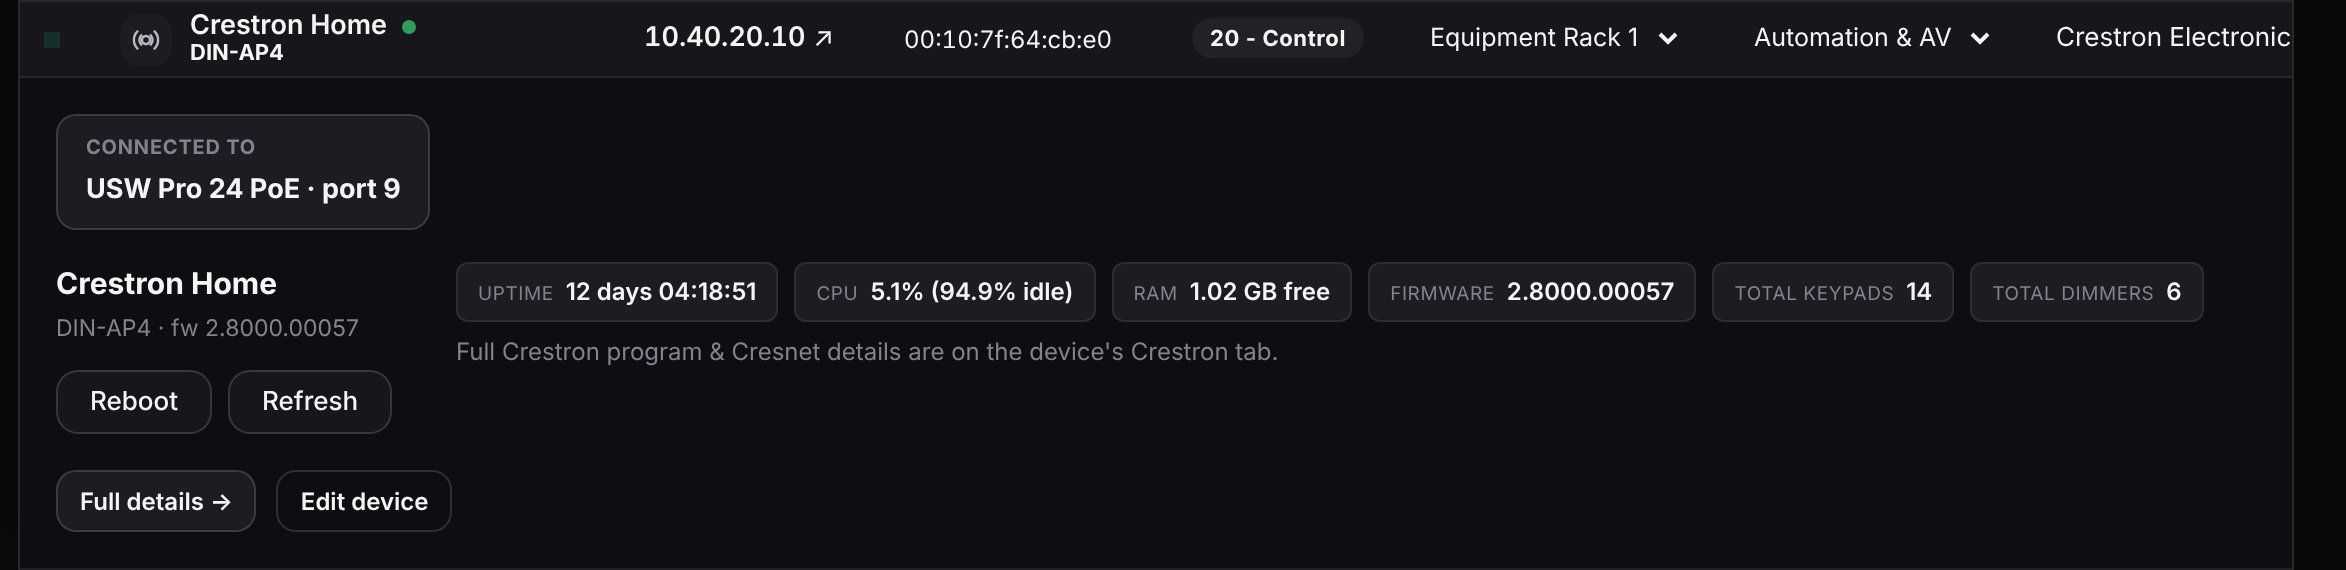
Processors and touch panels show their uptime, CPU, free memory and firmware, with Reboot and Refresh. A processor also shows how many keypads and dimmers it controls. The full program and Cresnet details are on the device's Crestron tab.
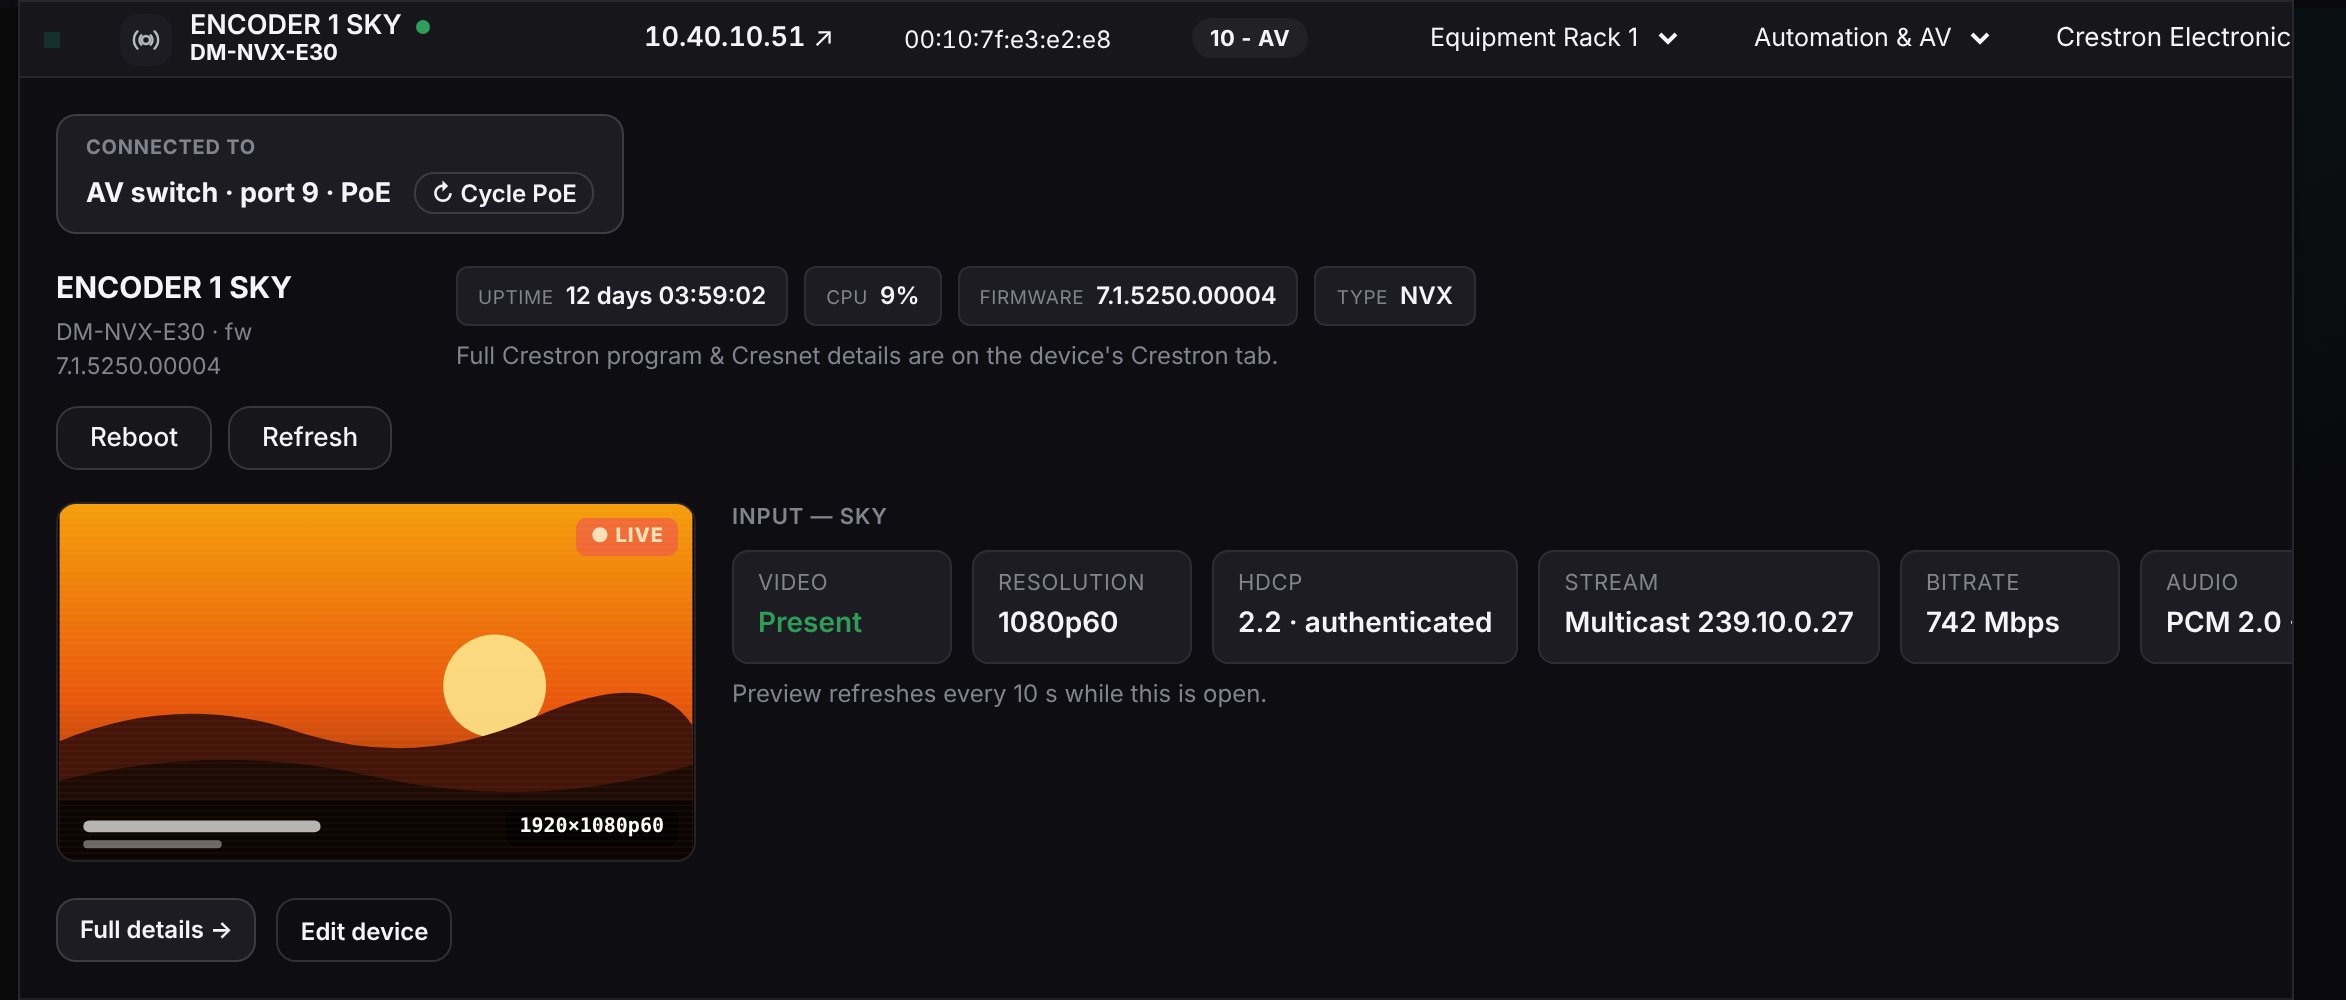
NVX video encoders and decoders add a preview of the picture going through them, refreshed every 10 seconds while the panel is open, with the signal details beside it: whether video is present, resolution, HDCP, the stream address, bitrate and audio. If a TV is blank, this tells you straight away whether the source is sending a picture.
Lutron lighting
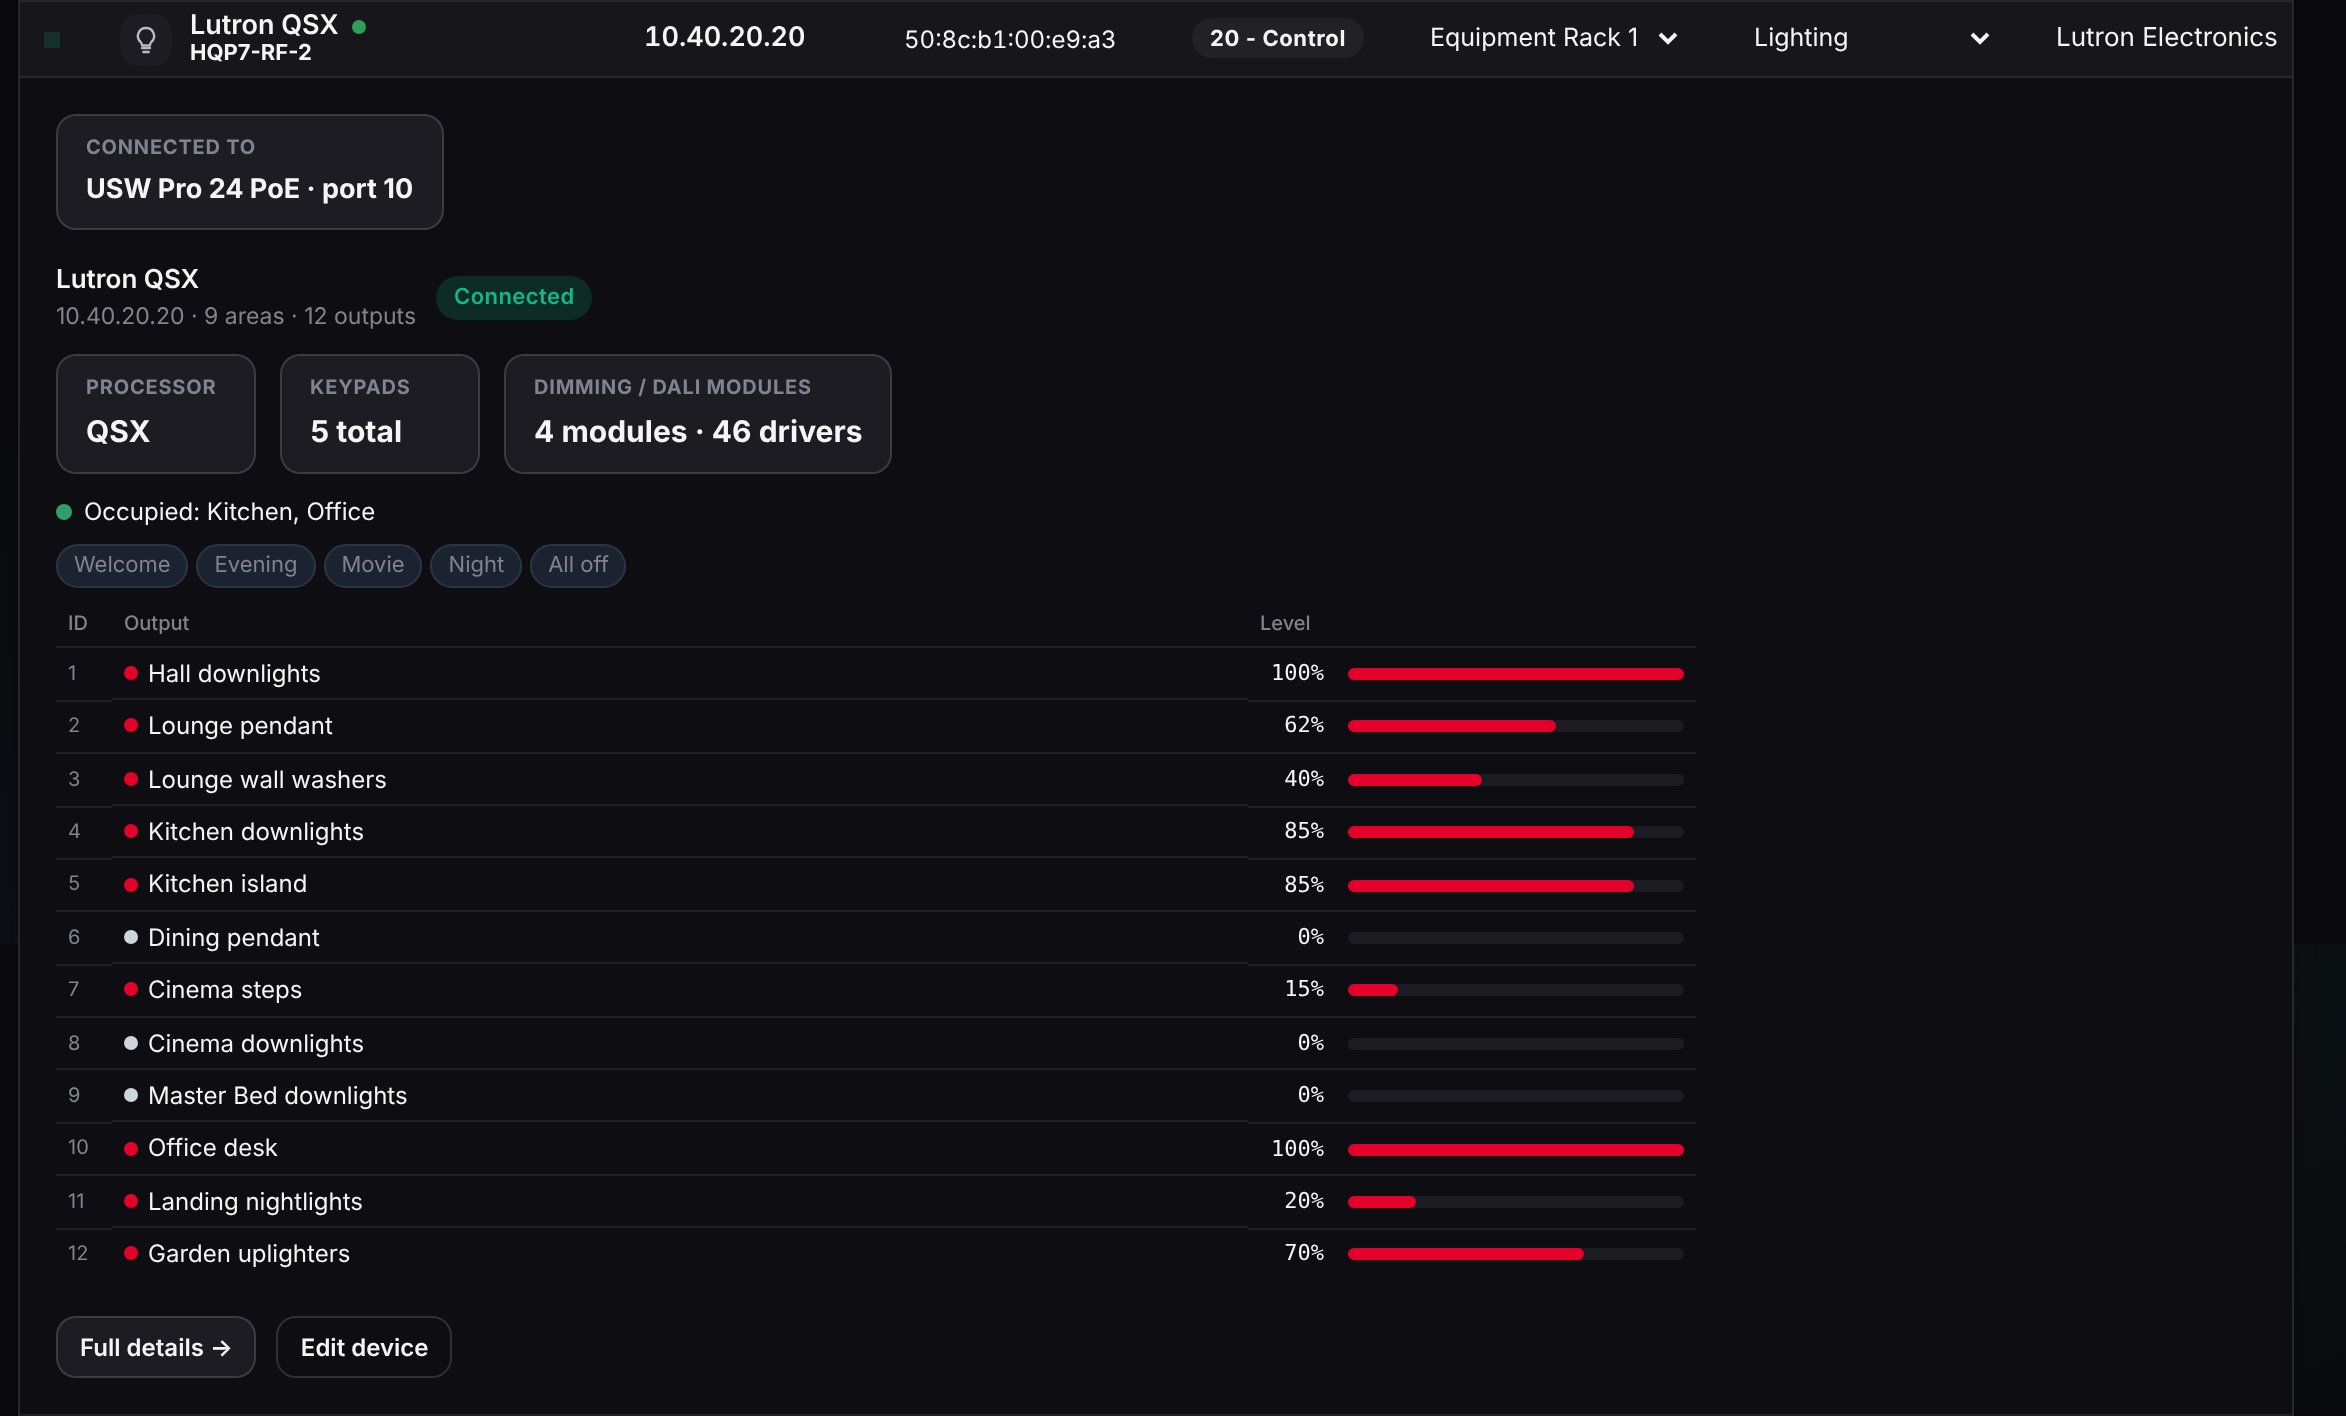
The lighting processor's connection state, how many keypads and dimming modules it has, which areas are currently occupied, the scenes, and every lighting circuit with its current level. A row of circuits at 0% when a room should be lit points straight to the problem.
Heating (Wiser)
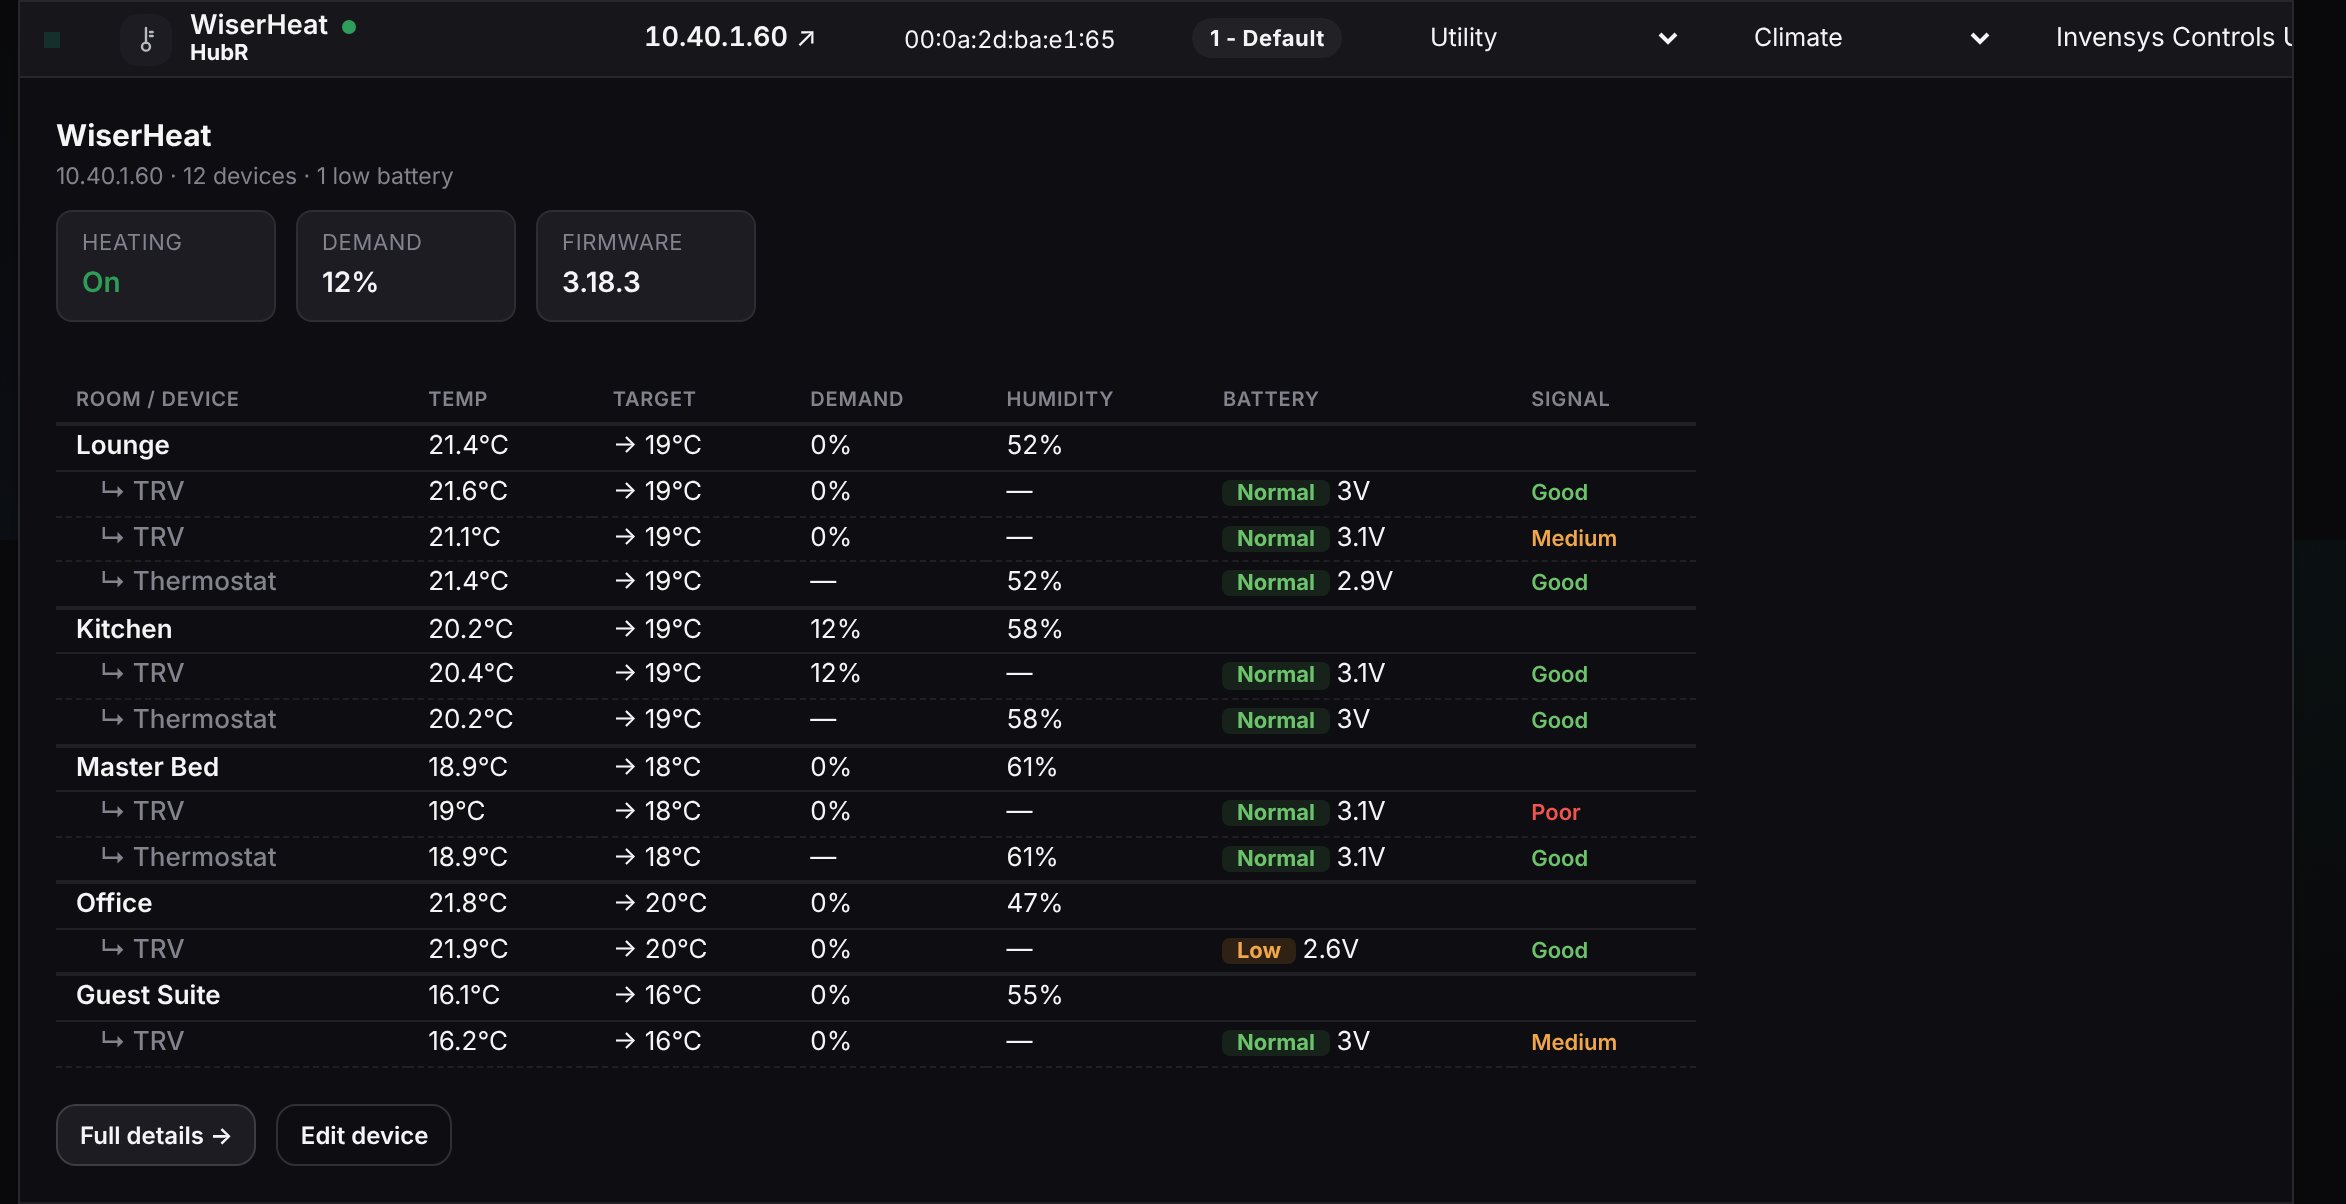
Whether the heating is on, overall demand and firmware, then each room with its temperature, target, demand and humidity. Under each room are its radiator valves (TRVs) and thermostats with their battery and signal. A Low battery or Poor signal is the usual reason one room won't warm up.
Storage (NAS)
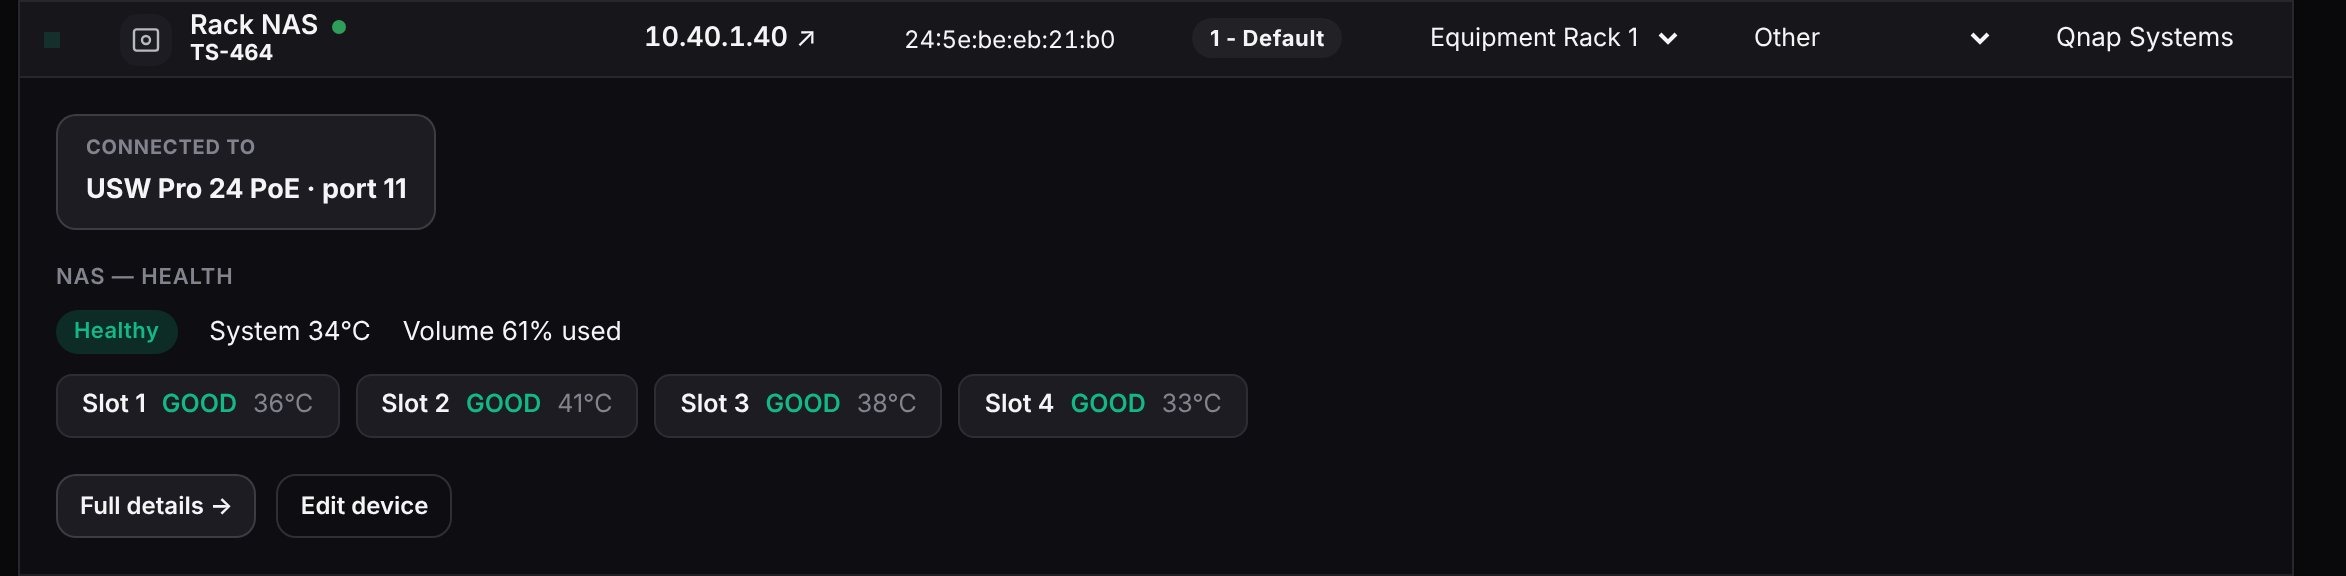
Overall health, system temperature and how full the volume is, then each disk slot with its status and temperature. Anything other than GOOD on a disk means it should be looked at before it fails.
Power (Gude PDU)
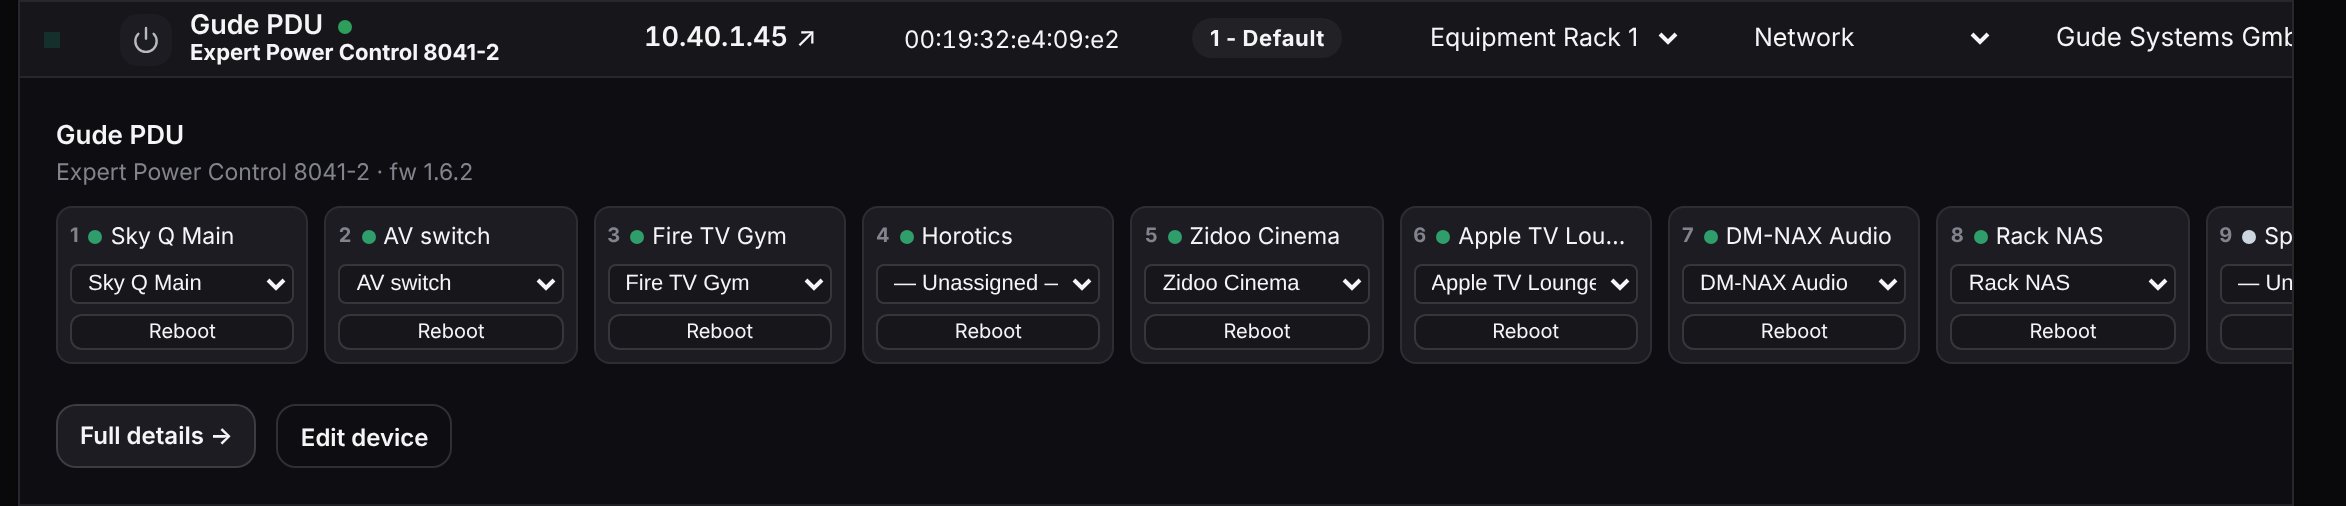
Each power outlet, the device it powers (chosen from the drop-down), and a Reboot button that switches that outlet off and on. It's a remote "turn it off and on again" for equipment that can't be restarted any other way. It always asks first.
Intercoms (2N)
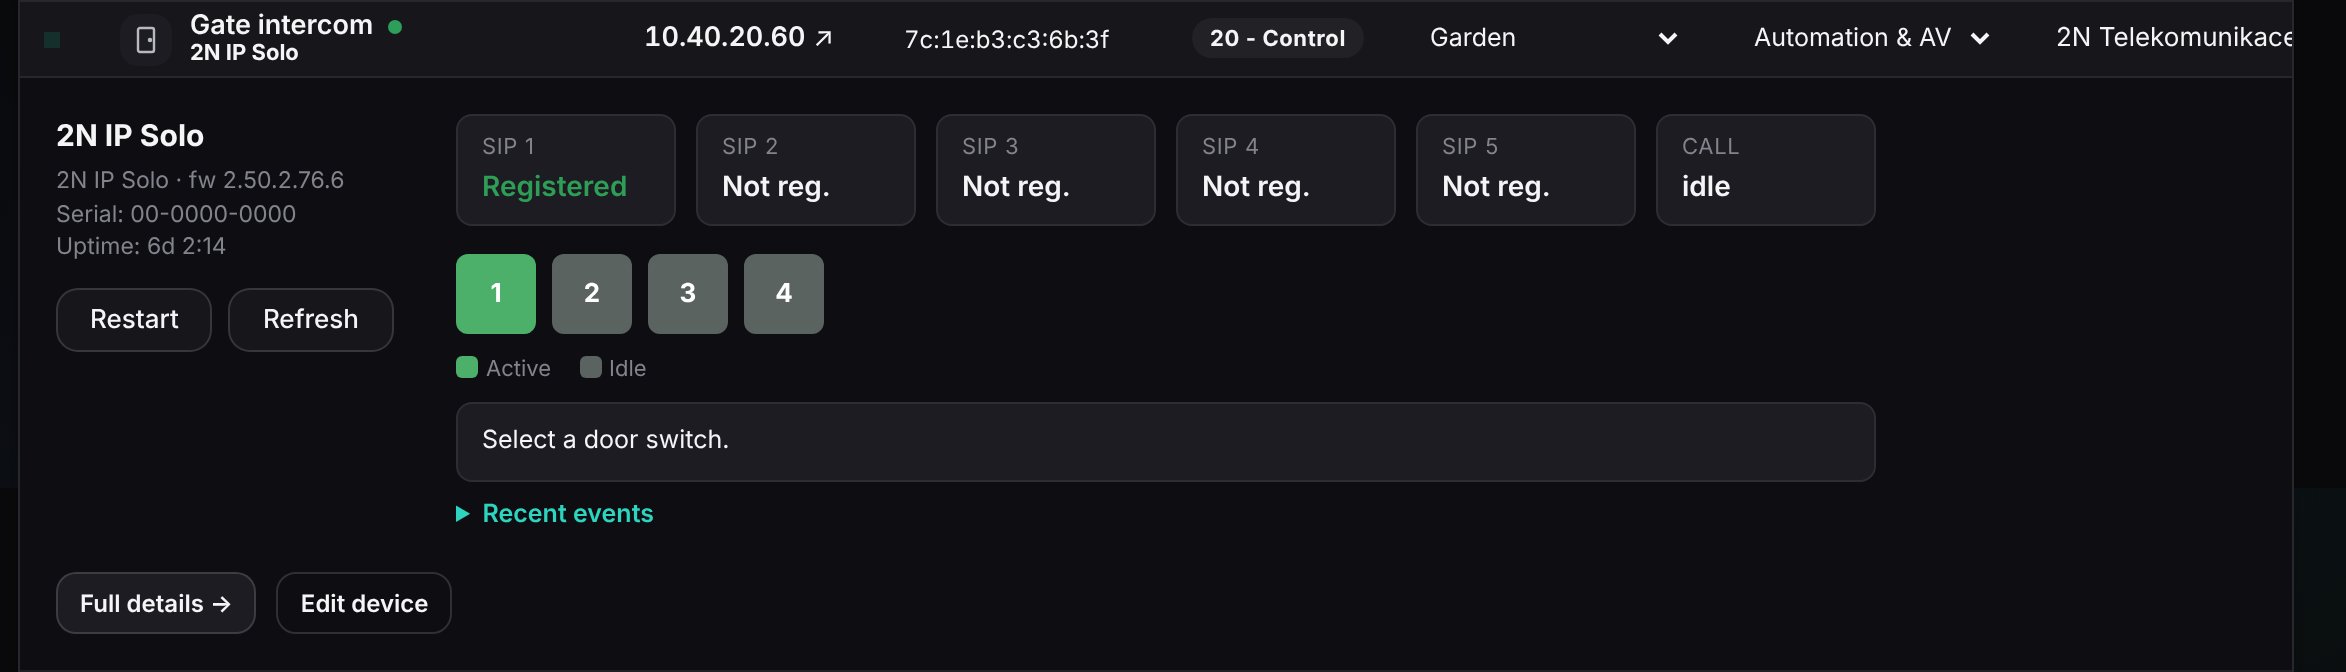
Firmware and uptime, whether each SIP account is registered (if it isn't, calls won't reach the phones), the current call state, and the door switches. Click a switch to see when it was last used. Recent events opens a list of calls and door releases.
Speakers and streamers
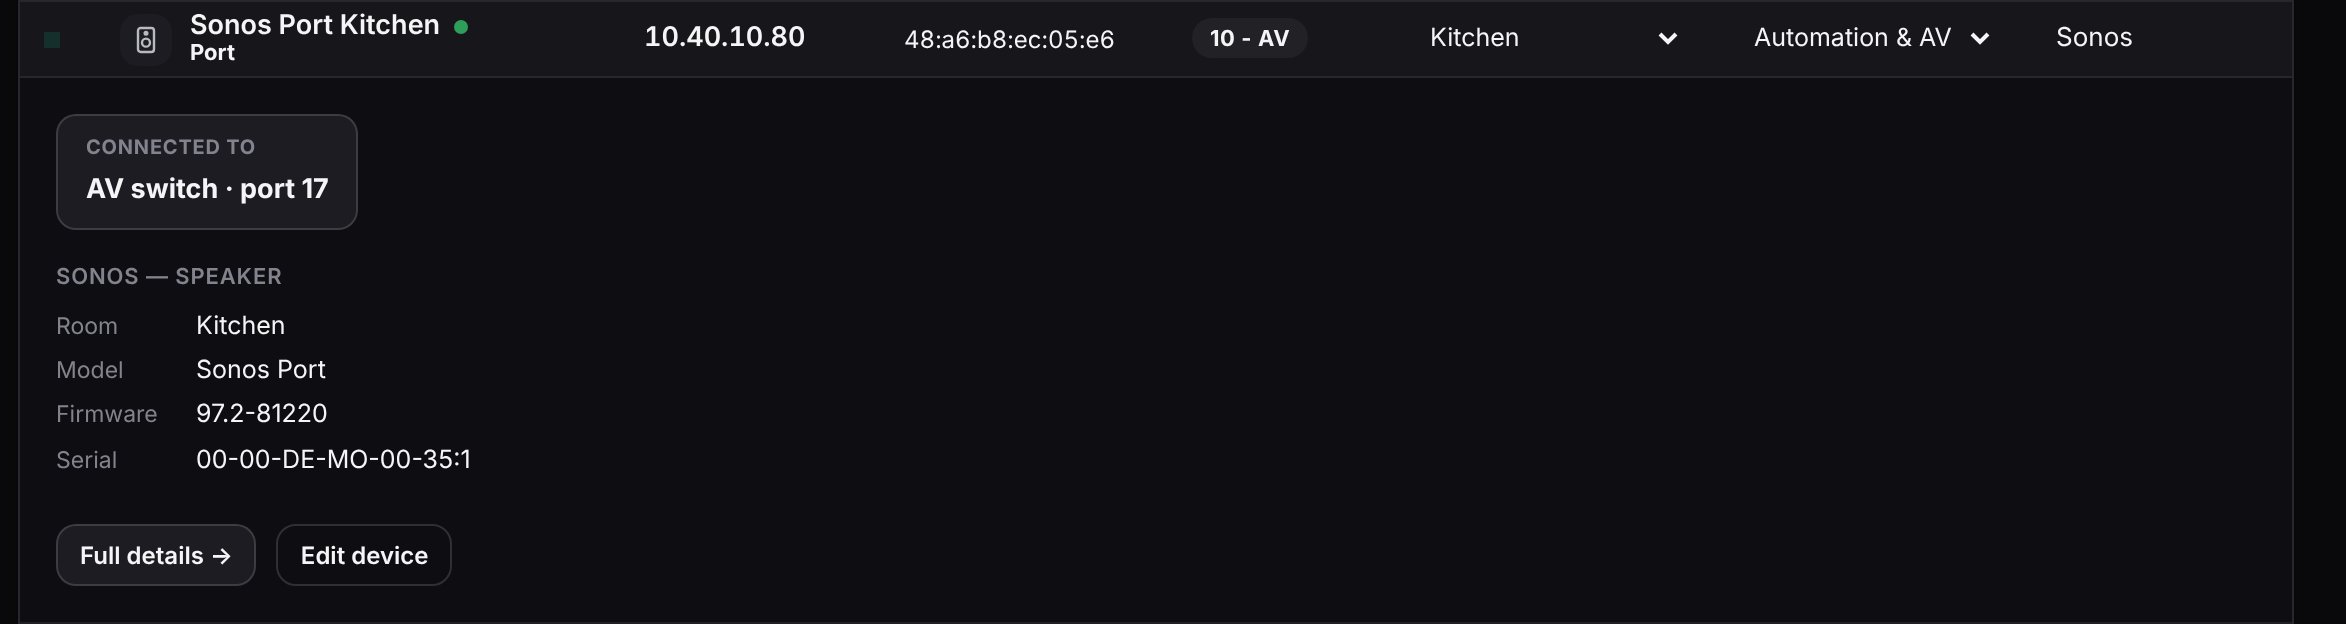
Sonos shows the room it's in, its model, firmware and serial number.
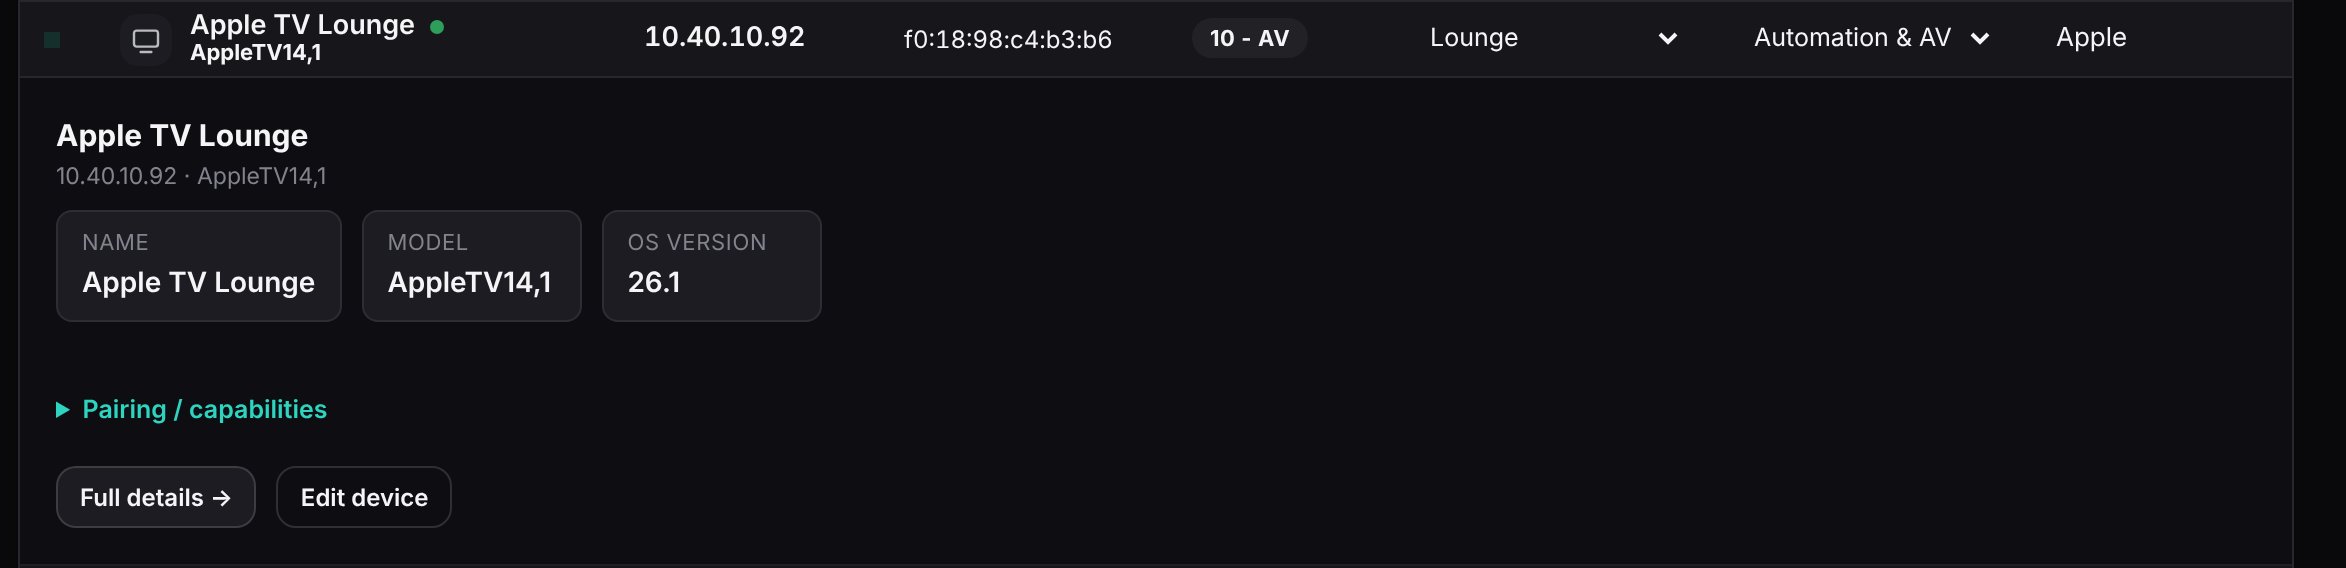
Apple TV shows its name, model and software version. Pairing / capabilities shows how Horotics talks to it and what it can see.
Everything else

Equipment without its own integration shows what it's plugged into, with Full details and Edit device. It's still watched in the same way. The device library is growing daily, so more equipment gets its own panel over time.
Nothing in a drop-down changes a device without asking you first. In the live demo, these buttons are switched off.
If something shows DOWN and you weren't expecting it, mention it to your installer. Everything else you can safely ignore.