A device's own page
See this on a live example →Click any device — from the Devices list, a subsystem, the topology map or a switch's port — and you land on its own page. Every device page shares the same top; the panels lower down change to suit the kind of device. The left menu and top strip are the same as everywhere (see the Overview page).
The top, on every device
- Name & summary — the device's name, with its model, address, room and what it's connected to underneath. ‹ Devices (top-left) takes you back to the list.
- Status & monitoring (top-right) — an ONLINE/DOWN chip, whether it's on Alerts, and an Edit button to change its label, room, category and monitoring.
- The tools row — quick actions: Restart, Ping and Traceroute (is it reachable, and by what route), SSH (a terminal, on the real system), Obsess (turn on intensive, high-frequency monitoring for a while), Alerts (this device's history), ✦ Ask AI (a read-only, advisory analysis of its logs — it never changes anything), and Delete.
- Four tiles — Status, Uptime, Firmware and Monitoring at a glance.
- Details and Open ports & services — further down, the full identity (IP, MAC, hostname, VLAN, room, manufacturer, first seen) and the network “doors” it has open.
Panels that change by device type
Between the tiles and the Details, each device shows the panel that suits it:
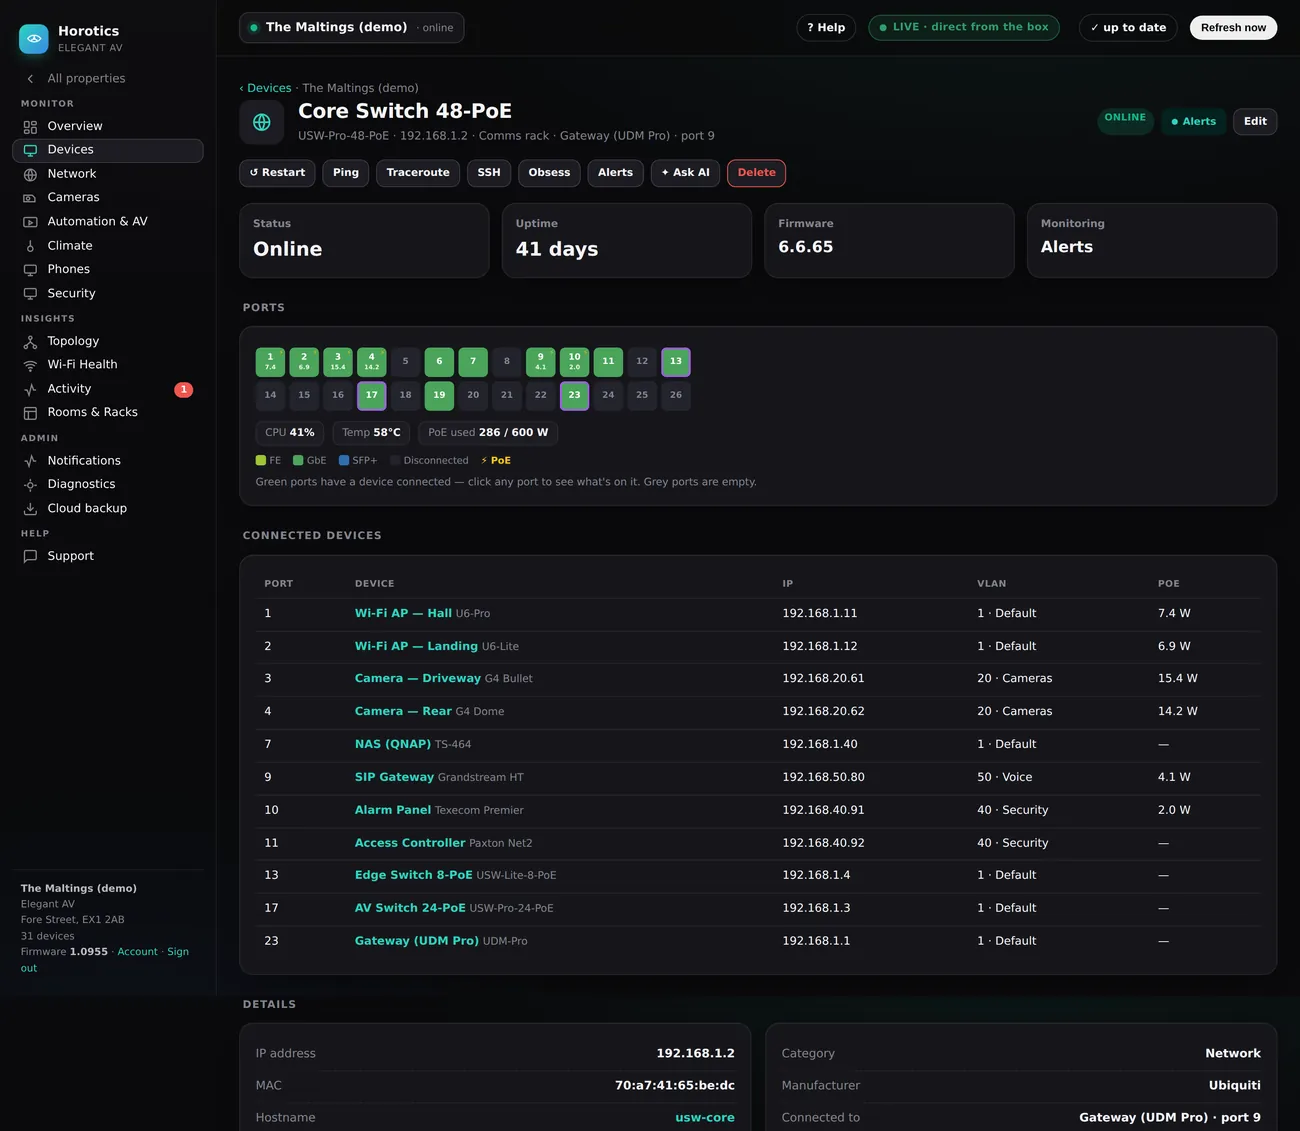
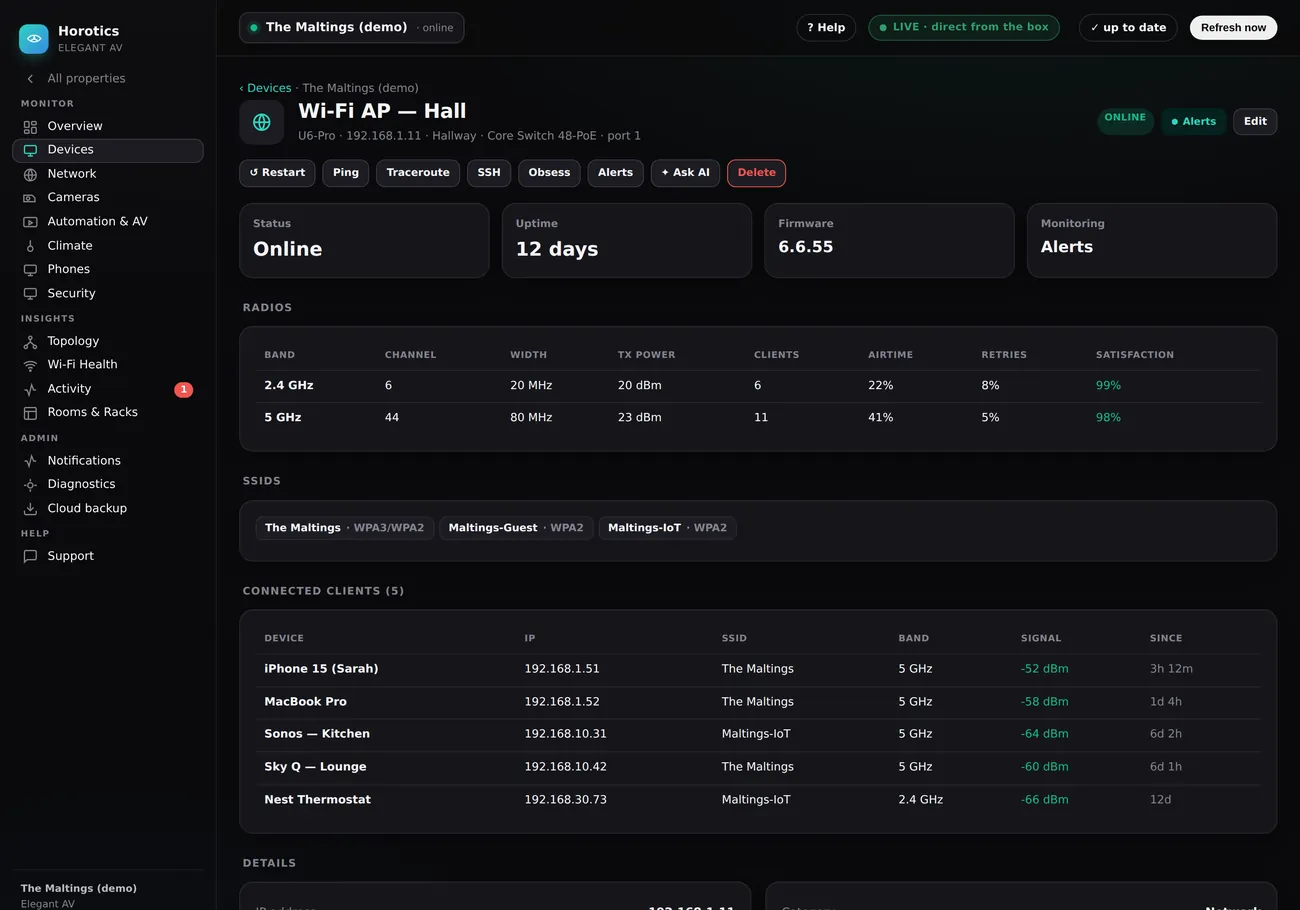
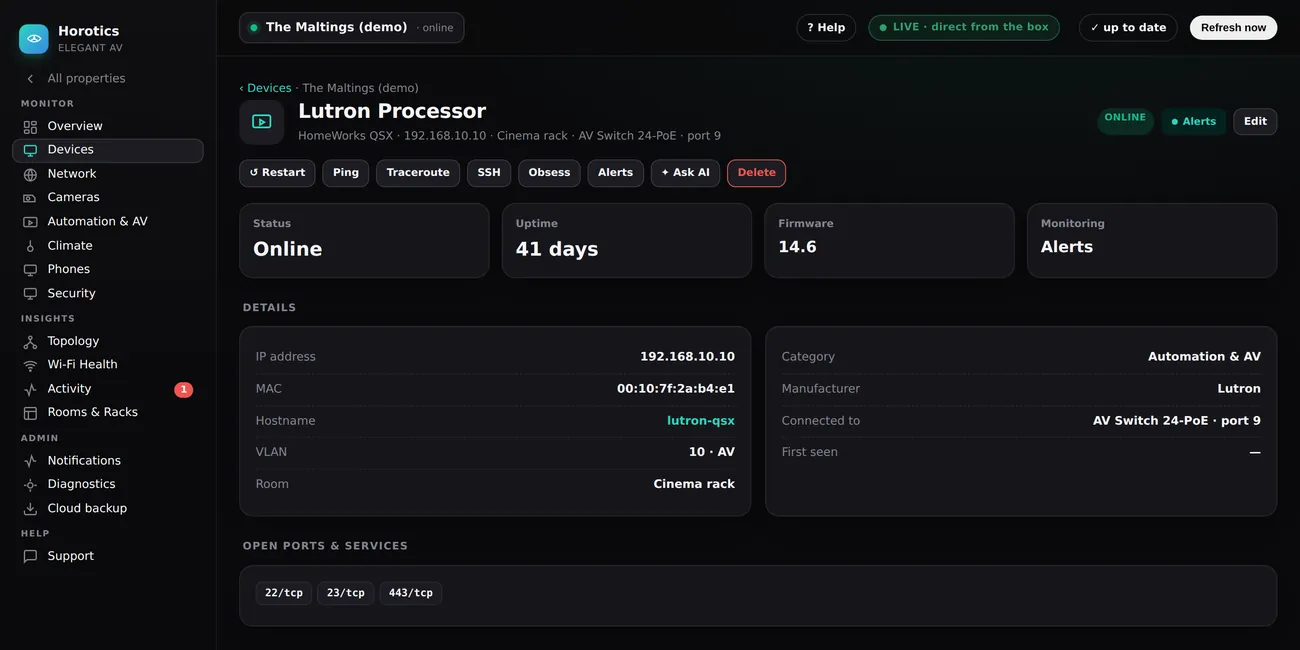
Smart devices show a live control panel
Smart kit shows an extra panel built for it, read live from the equipment. Here are the ones in the demo:
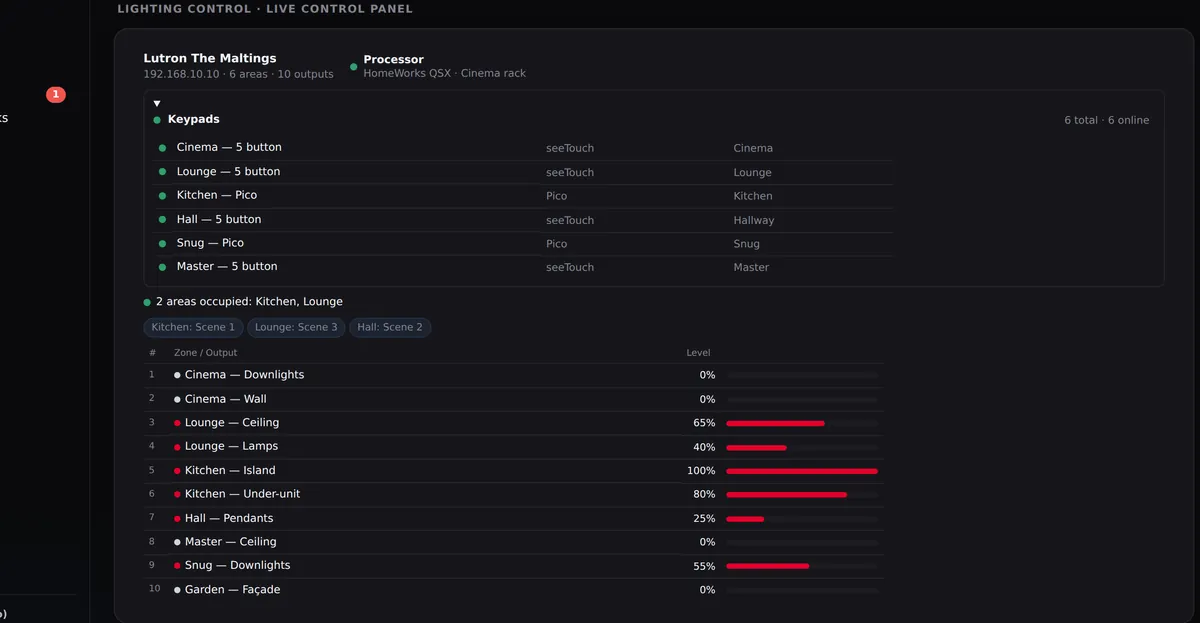
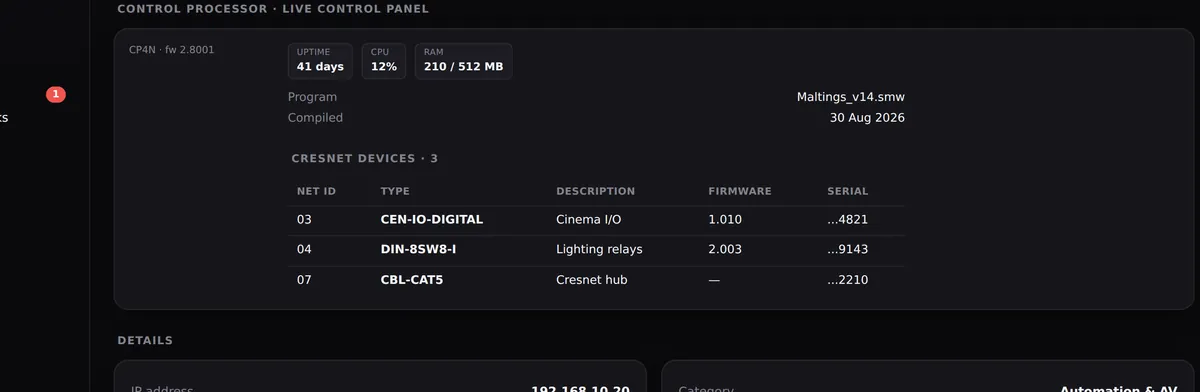
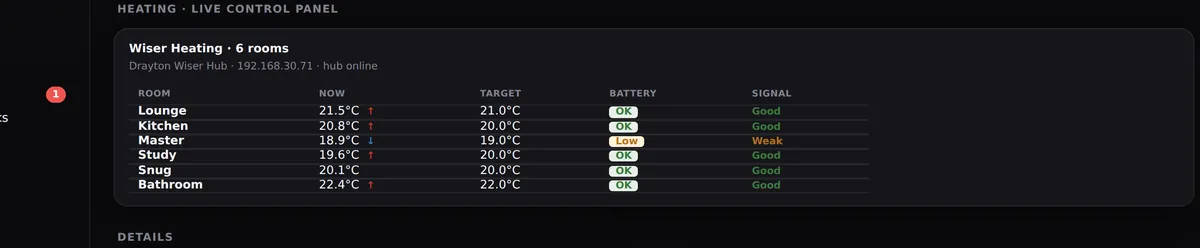

Other integrations the box supports (Sonos, Apple TV, alarm and access panels, PDUs and so on) show their own panel in the same way on a real system.
You can't break anything by looking. The tools are safe, and anything that would actually change the device asks you first.
Still stuck? Your installer can see the same screens you can and sort most things remotely — there's a Support button inside your Horotics portal.