The Topology map
See this on a live example →The Topology map shows what's plugged into what — the family tree of your system, exactly as the appliance draws it. The left menu and top strip are the same as everywhere (see the Overview page); you're on Topology under Insights.
How to view it
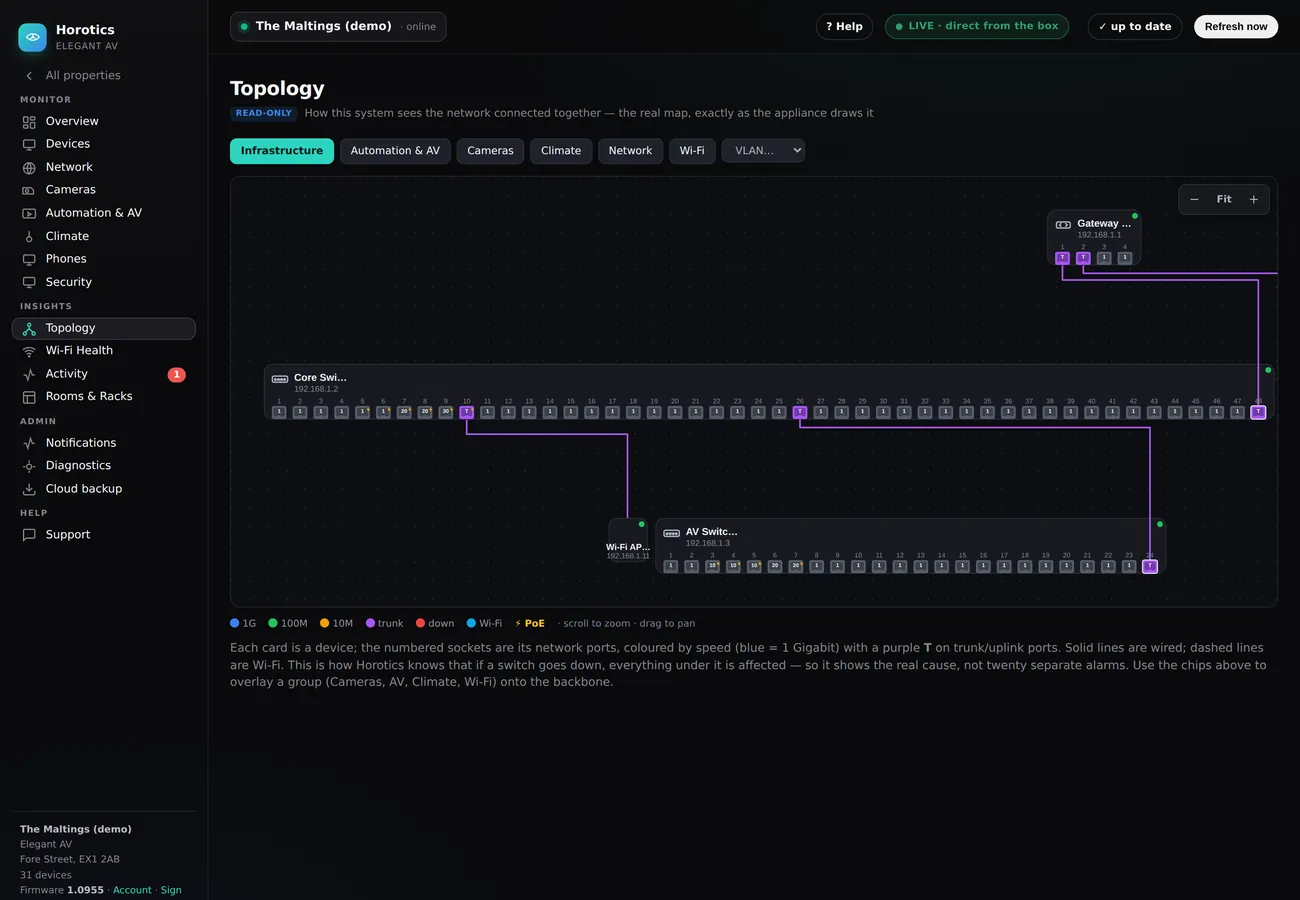
- The chips along the top switch what you see: Infrastructure shows just the backbone; Cameras, Automation & AV, Climate and Network overlay that group; Wi-Fi shows wireless devices; and the VLAN… dropdown highlights one network lane. Click a chip and the map redraws for it.
- Zoom & pan — use the − Fit + buttons (top-right of the map), or scroll to zoom and drag to move around a big map. Fit snaps the whole map back into view.
- Read-only — like the whole customer view, you can look but not change anything here.
How to read the map
- Each card is a device; the little numbered squares are its network ports.
- Ports are coloured by speed — blue = 1 Gigabit, green = 100 Meg — with a purple T on trunk/uplink ports (the ones that carry everything between switches).
- Solid lines are wired connections; dashed lines are Wi-Fi.
- A red port or a red dot means that device is down.
Seeing a single VLAN
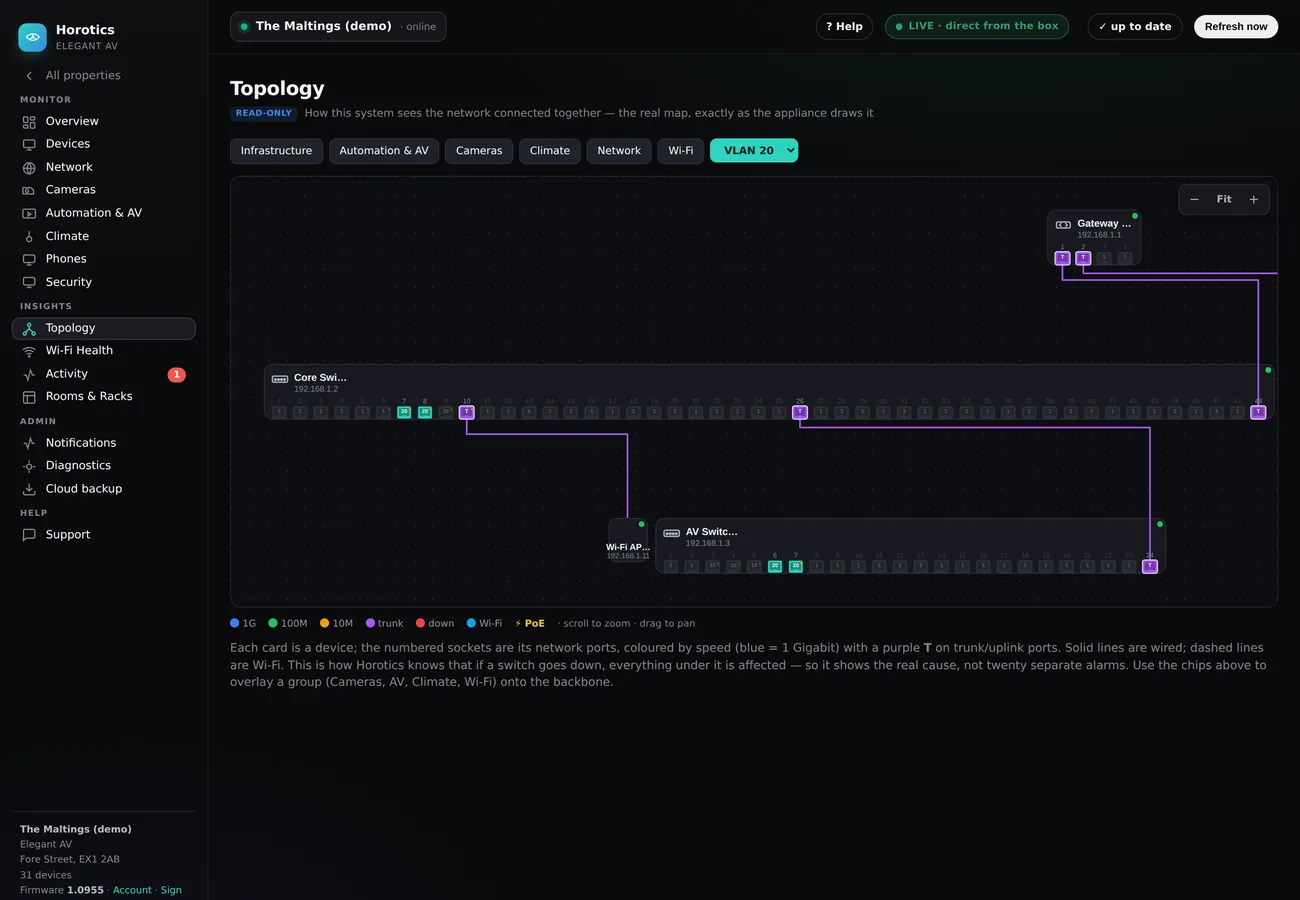
Why it's genuinely useful
Because Horotics knows the wiring, it understands cause and effect. If a switch loses power, everything beneath it goes quiet too — but instead of twenty red alarms, Horotics tells you the one thing that actually broke.
Still stuck? Your installer can see the same screens you can and sort most things remotely — there's a Support button inside your Horotics portal.