Your dashboard (Overview)
See this on a live example →The Overview is your home page. Open it and, in one glance, you know whether your system is happy.
The menu down the left-hand side
The dark bar down the left is how you move around. It’s the same on every page, so once you know it you know the whole system. The item you’re currently on is highlighted. It’s split into labelled groups:
At the very top — the Horotics logo (your installer’s name sits beneath it), then ‹ All properties, which takes you back out to the list of every site on your account. Handy if you look after more than one property.
Monitor — the everyday views, each opening the equipment in that area:
- Overview — this page: the whole-system summary.
- Devices — the full list of every piece of equipment, with search and filters.
- Network — just your network kit: gateway, switches, Wi-Fi points, storage and power.
- Cameras — your CCTV cameras and recorders.
- Automation & AV — TVs, speakers, amplifiers, lighting and control processors.
- Climate — heating, cooling and anything temperature-related.
- Any further entries here (for example Phones or Security) are extra groups set up for your particular system.
Insights — the deeper, whole-system views:
- Topology — a map of how everything is wired together, gateway at the top.
- Wi-Fi Health — a card per access point showing how busy and healthy your Wi-Fi is.
- Activity — the running history of everything that has happened. A small red number here counts unread alerts.
- Rooms & Racks — your kit arranged by room, with a picture of each equipment rack.
Admin — the housekeeping views:
- Notifications — the alerts this site has raised, and where you manage them.
- Diagnostics — deeper technical detail, mostly for your installer.
- Cloud backup — the safe copy of your system’s settings held in the cloud.
Help — Support opens the page for contacting your installer.
At the very bottom — your site’s name, address and device count, the box’s Firmware version, an Account link (your login, password and security settings) and Sign out.
The strip along the very top
A thin bar runs across the top of every page. Working across it:
- Site name + status dot (left) — a green dot and online means the box is connected to the cloud. It turns red and reads offline if the box drops off.
- ? Help — opens this plain-English guide for whichever page you’re looking at.
- LIVE · direct from the box — you’re seeing the box’s own data in real time. If it instead reads Snapshot · from the cloud, you’re looking at the last copy the box sent up — press Refresh to pull the latest.
- up to date — confirms the reading is current (it shows how long ago the data is if not).
- Refresh now — fetches the very latest reading from the box on demand.
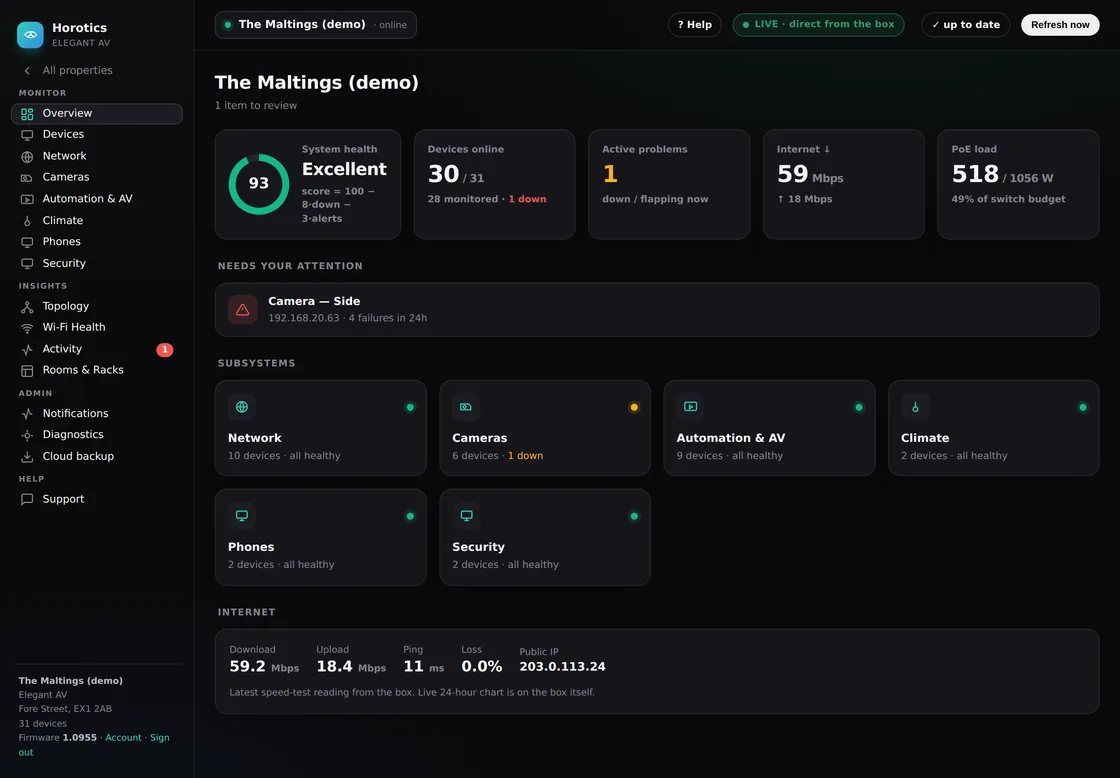
The five figures across the top
- System health — a single score out of 100 in a coloured ring, with a word next to it (Excellent / Good / Fair / Poor). Green and near 100 means all is well. The small print (100 − 8 × down − 3 × alerts) just means every offline device or active alert nudges the score down a little.
- Devices online — how many things are answering, out of the total. Underneath: how many you’ve asked Horotics to watch (monitored), and how many of those are down.
- Active problems — how many things are down or flapping right now. It’s green on zero. This one is a button — click it to jump straight to the Activity list.
- Internet ↓ — your latest broadband download speed, with upload shown underneath.
- PoE load — how much power your main switch is sending down the network cables to things like cameras and Wi-Fi points, against how much it can supply. A high percentage means the switch is near its limit.
(Active problems is the only card you can click; the other four are read-outs.)
Needs your attention
A short list of anything down or flapping — the device’s name, its address, and why it’s flagged, newest first, each with a red warning icon. When there’s nothing wrong it simply shows a green tick and says All clear.
Subsystems
Your system in simple groups — Network, Cameras, Automation & AV, Climate (and any custom ones such as Phones or Security). Each tile shows a dot and a count: a green dot and “all healthy” is good; an amber dot with “N down” means look there first. Every tile is a button — click one to open that group (the same as the matching item in the left-hand menu).
Internet
The full broadband readout from the box’s latest speed test: Download and Upload speeds, Ping (how quickly it responds), Loss (whether any data is being dropped), and your Public IP (your home’s address on the internet). A live 24-hour chart lives on the box itself.